The Serverless Guide to AWS CloudWatch Logs Insights

CloudWatch Logs Insights is the interactive log search and analysis solution within AWS. It is a powerful analytics tool that enables you to search and query your log data. It provides you with a bespoke query syntax to debug and extract insights from your applications.
CloudWatch Logs Insights is one of the essential pieces of any serverless architecture, and we will outline its benefits, limitations, and pricing in human terms.
Foundations
Some foundations will help when using CloudWatch Logs Insights to understand your application. Here is a rundown:
Log Event
A log event is a record containing information emitted from your systems.
CloudWatch automatically captures log events from the standard out and standard error streams of your AWS Lambda functions. For instance, each console.log in your JavaScript Lambda functions or fmt.Println in your Golang Lambda function. You can also send log events with the AWS SDKs or CLI using the put-log-events API.
Each log must have a timestamp and message.
Log Stream
A CloudWatch Log Stream is a sequence of log events; log streams are helpful to isolate log entries that happened within the same context. When used with the AWS serverles ecosystem, each AWS Lambda instance gets a unique log stream.
This is ideal for low-traffic systems or during developement, as individual Lambda invocations or consecutive invocations will belong to the same log stream, making it easier to quickly find them. However, log streams can become difficult to manage on systems with high traffic, as consecutive invocations are likely to trigger multiple AWS Lambda instances, creating multiple Log Streams and making it difficult to quickly find logs in CloudWatch.
Log Group
A CloudWatch Log Group is a collection of log streams; it is possible to set retention policies and access control settings on logs groups, giving you more control over your infrastructure and ultimately, your cloud bill.
For AWS Lambda, each Lambda function typically gets a unique log group.
Query Syntax
CloudWatch Logs Insights uses a custom query language designed to filter and manipulate data in your CloudWatch log groups.
Queries built with this query language are unstructured and typically composable, enabling you to reuse snippets from your existing queries or any examples you find online easily.
Analyzing Log Data
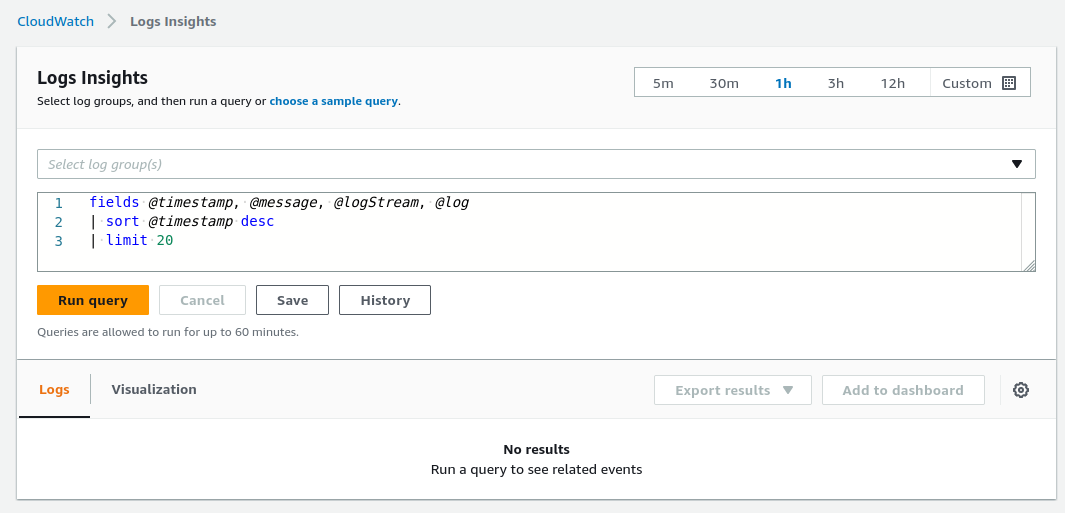
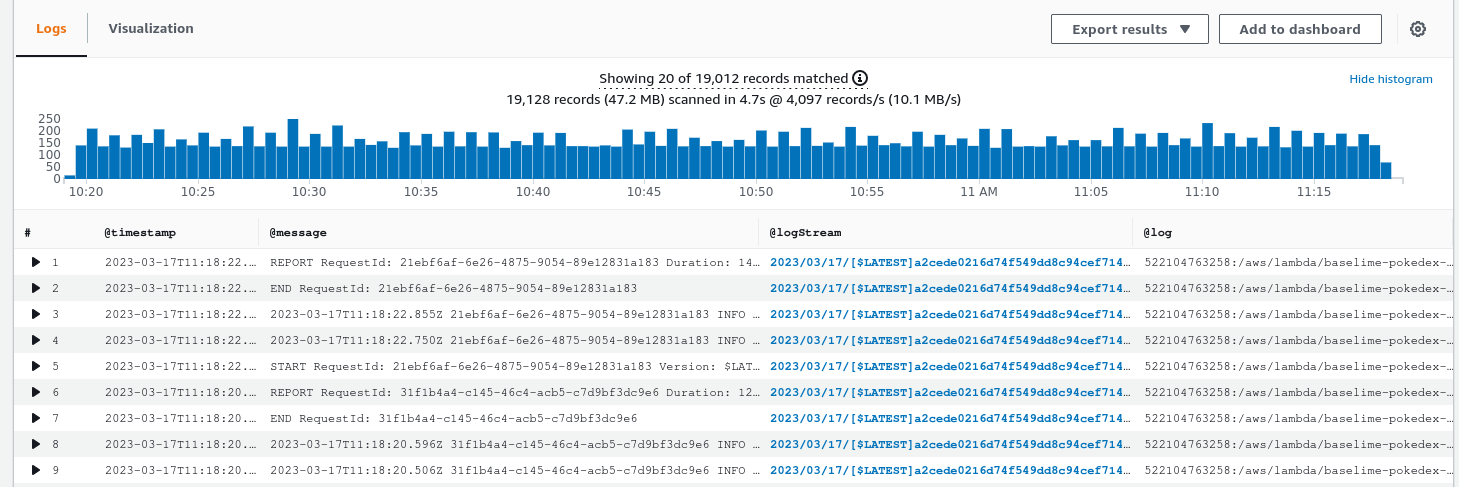
The first step to querying logs in CloudWatch Logs Insights is selecting the log groups to query. CloudWatch Logs Insights supports querying up to 50 log groups in a single query. Moreover, query results are available for 7 days, and queries timeout after 60 minutes [source].
When ingesting data from other AWS services, CloudWatch typically adds discovered fields to your logs, to facilitate querying. For instance, when ingesting logs from AWS Lambda functions, CloudWatch adds fields such as @timestamp, @logStream, @message, @requestId, @duration, @billedDuration, @type, @maxMemoryUsed, @memorySize. The full set of discovered fields is outlined here.
Displaying Data: fields and display
The first step to uncovering insights from your logs is typically selecting the data to display. There are 2 operators for displaying data in CloudWatch Logs Insights: fields and display.
Displaying a Field: fields
The field command is used to show specific fields in the query results.
fields @timestamp, @requestId, @message
The query above shows the @timestamp, @requestId, and @message in every log entry.
The fields command can be used to create new fields for the query or modify field values. The example below creates a new field total as the sum of count and num and shows it in the query results.
fields count + num as total
Moreover, the field total can be used in the remainder of the query as if it was part of the log events, for example, to filter the log events based on the value of total.
Displaying the Results of a Query: display
The display command is very similar to the fields command, as it is used to define the fields to display in a query. However, it has multiple limitations:
- It should be used only once per query, as only the last
displaycommand in the query is applied - It cannot be used to create new ephemeral fields to use elsewhere in the query
As such, the display command should typically be used when you don't want to use the fields command.
Filtering Data: filter
CloudWatch Logs Insights provides powerful filtering capabilities to find any event using the filter command.
Working with Strings
To filter on string values, CloudWatch Logs Insights provides the keyword like and the regular expression operator ~=.
filter message like "Exception"
In the example above, we're filtering all log entries where the message includes the substring Exception.
It's possible to combine multiple filters using the and and or keywords, and negate specific operations with the not keyword.
filter message like "Exception" and message not like "Handled" and error ~= /40.*/ or error like /50.*/
A handy tip is to make your queries more readable is to use multiple filter commands to chain filters instead of and.
filter message like "Exception"
| filter error ~= /40.*/
Working with Numbers
To filter on numbers, CloudWatch Logs Insights provides arithmetic comparison operators: =, !=, <, <=, >, >= that work exactly how you'd expect them to.
filter count > 32
Parsing JSON and Strings: parse
The parse command is used to extract data from JSON blobs and strings into ephemeral fields that can be used in subsequently in the query (for display, filtering or calculations...).
The parse command intuitively matches the string or JSON blob and pulls out the data matching the position of the * character.
Considering this log entry:
24 March 2023 21:09:43,241 [ERROR] {'error': 'ValidationError', 'status': 400} User affected: 123456
The snippet below extracts level, exception and user from the log entry.
parse @message "[*] 'error': '*' User affected: *" as level, exception, user
As such, level has the value ERROR, exception is ValidationError and user is 123456.
Computing Statistics: stats
The stats command enables you to compute aggregates statistics on log entry fields. To use CloudWatch Logs Insights beyond relatively trivial debugging, it is essential to get familiar with the stats command. Appropriate use of the stats command will uncover trends and deeper insights into the behaviour of your applications.
Mutltiple functions are available, from aggregate functions such as avg, count, max, or min to non-aggregate functions such as earliest or latest. A complete list with descriptions is available in the documentation.
The example below computes the average duration of AWS Lambda invocations based on the logs.
filter @type = "REPORT"
| stats avg(@duration)
The CloudWatch Logs Insights query language provides a bin function that enables us to group results by time periods. For example, we can view the average duration of Lambda function invocations every 5 minutes with the following query.
filter @type = "REPORT"
| stats avg(@duration) by bin(5m)
The stats command can be used to build relatively complex queries.
Sorting Results: sort
The sort command is used to sort the results in ascending or descending order based on a field.
The query below shows the AWS Lambda invocations with the highest billed duration, by displaying the request ID and billed duration, sort by billed duration in descending order.
filter @type = "REPORT"
| fields @requestId, @billedDuration
| sort by @billedDuration desc
Controlling the Results: limit
The limit command is used to restrict the number of rows displayed in the query results. It should however be noted that the limit command does not reduce the amount of data scanned by CloudWatch Logs Insights.
filter @type = "REPORT"
| fields @requestId, @billedDuration
| sort by @billedDuration desc
| limit 10
The query above shows the 10 AWS Lambda invocations with the highest billed duration.
Pricing in Human Terms
CloudWatch Logs and Logs Insights have generous free tiers for small applications. They can ingest and query up to 5GB of log data for free each month.
Once your application exceeds the tier quota, CloudWatch Logs Insights can get expensive.
The following pricing outlines pricing the eu-west-1 region. Please refer to the official documentation different regions.
- $0.50 per GB ingestion cost
- $0.03 per GB storage cost
- $0.005 per GB of data scanned to query
- $0.12 per GB of data Scanned to protect and mask sensitive data
Pricing Example
Let's say you run a small application exclusively on AWS Lambda. With low traffic, your functions are invoked 100 times a minute. You're producing 50kb of log data with each invocation. We are assuming a retention period of 30 days across your log groups:
- Number of invocations per month: 100 * 43,800 = 4,380,000 invocations
- Data total: 219 GB of log data
- Ingestion cost: $109.5
- Cost to store for 1 month: $6.57
- Cost to mask sensitive data: $26.28
Assuming you don't act on your log data, the cost of CloudWatch Logs is $142.35.
However, observability without action is just storage.
Assuming your run 100 queries daily on your log data, each scanning 20GB of log data:
- Number of queries: 3,000
- Data Scanned: 60TB
- Query cost: $300
Total Cost: $442.35
Cost Optimisation
In order to optimise your CloudWatch Logs and Logs Insights bill, you should aim to keep data your data within CloudWatch only for the duration the data is vital for operations, and archive it to long term storage afterwards. Additionally, it is necessary to limit the amount of data scanned during queries.
- Short retention periods: Depending on your compliance requirements, you should expire logs from CloudWatch when they are not relevant for your operations anymore
- Short query time ranges: CloudWatch charges per GB of data scanned when running queries. Limiting the time range of your queries will reduce your bill

We recommend against ingesting less data to reduce the CloudWatch bill. It's true that some logs may seem unnecessary, but this telemetry data is our window into our systems, and removing logs can be the cause of blind spots when investigating defects or during incidents.
Conclusion
CloudWatch Logs Insights is typically the first step in modern observability for developers working with serverless architectures. It's a powerful solution that enables you to get an understanding of the inner workings of your applications. However, it has quite a few limitations, and the pricing model disincentivises actually making use of your logs.
We're working on a better observability solution for serverless architectures: Baselime. It enables you to ask deeper questions of your systems, ties together your logs, metrics, traces and all other telemetry data, and its simple pricing model encourages making use of your telemetry data.
Try it out, it's free.
Next Steps
- Join the Baselime Slack and share what you’ve built or ask for help.
- Let us know what topics you’d like to see covered next!