Understand your Serverless Stack with Baselime Tracing
We're excited to introduce Baselime distributed tracing, with support for both OpenTelemetry and AWS X-Ray.
With Distributed Tracing on Baselime, you can:
- Find outliers and spot trends by running arbitrary queries on your tracing data
- Visualise individual traces to get a deeper understanding of how your stack behaves
- Correlate AWS Lambda and API Gateway logs from CloudWatch with traces from AWS X-Ray to accelerate your troubleshooting
Traces are essential to answering some of the more perplexing questions about your stack:
- Why are my lambda functions slow?
- Where can we improve performance?
- Which parts of our infrastructure can be moved to async jobs?
- How much do cold-starts account for our latencies?
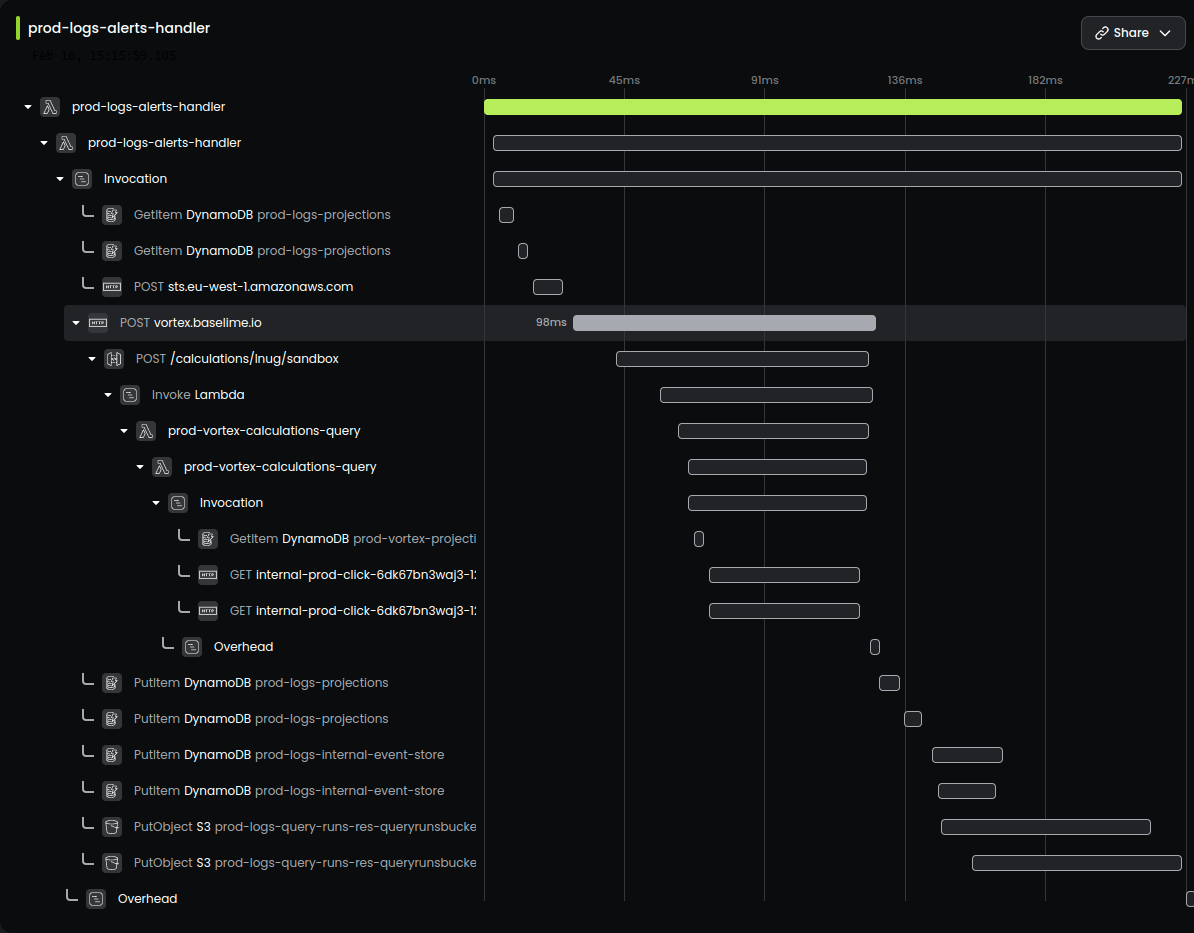
This waterfall view of a trace is a great way to understand the behaviour of a single request. In addition, as developers, we also want to understand the overall behaviour of our system. And that's where Baselime shines! Baselime aggregates tracing data in real-time and indexes every single field so you can run arbitrary queries on the insights embedded in your traces.
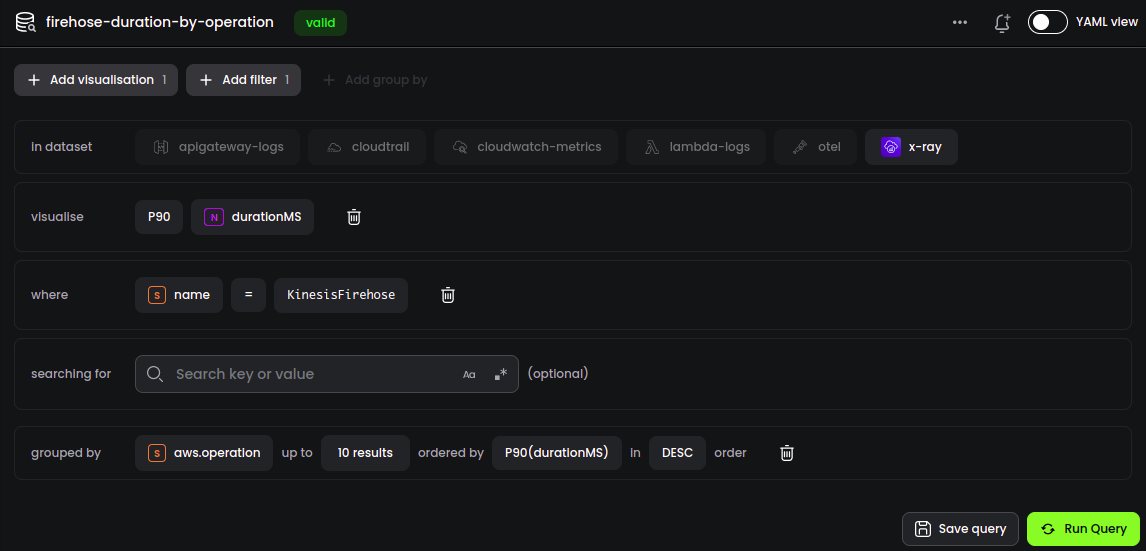
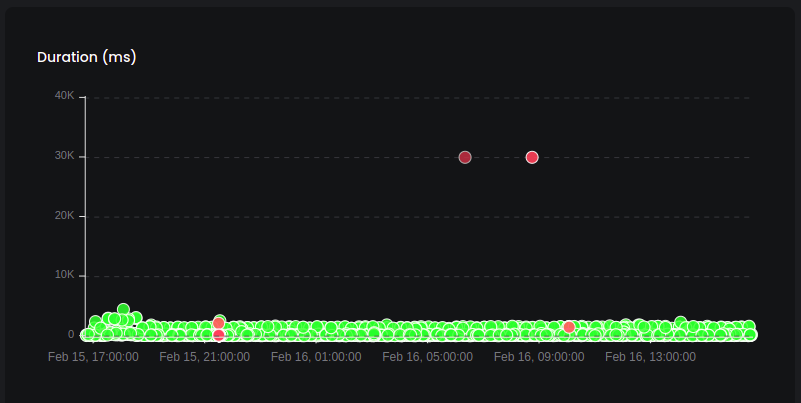
This gives you the power to quickly spot outliers, trends and errors across your traces. Baselime features an interactive scatter visualisation every time you run a query. In this chart, traces are color-coded:
- green for successful calls
- red for calls with an error anywhere in the waterfall
The x-axis is the start time of the trace and the y-axis its total duration, across all service calls.
The chart is interactive so you can view the waterfall diagram of the trace by clicking any of the dots.
Once a specific trace with a defect is identified, typically, you'd want to check the logs for that specific call. Baselime correlates your AWS Lambda and API Gateway logs from CloudWatch with your X-Ray traces, enabling you to smoothly transition from traces to logs and get answers without switching tools or tabs. By clicking on any of the spans of the trace, you can view the logs for that specific trace.
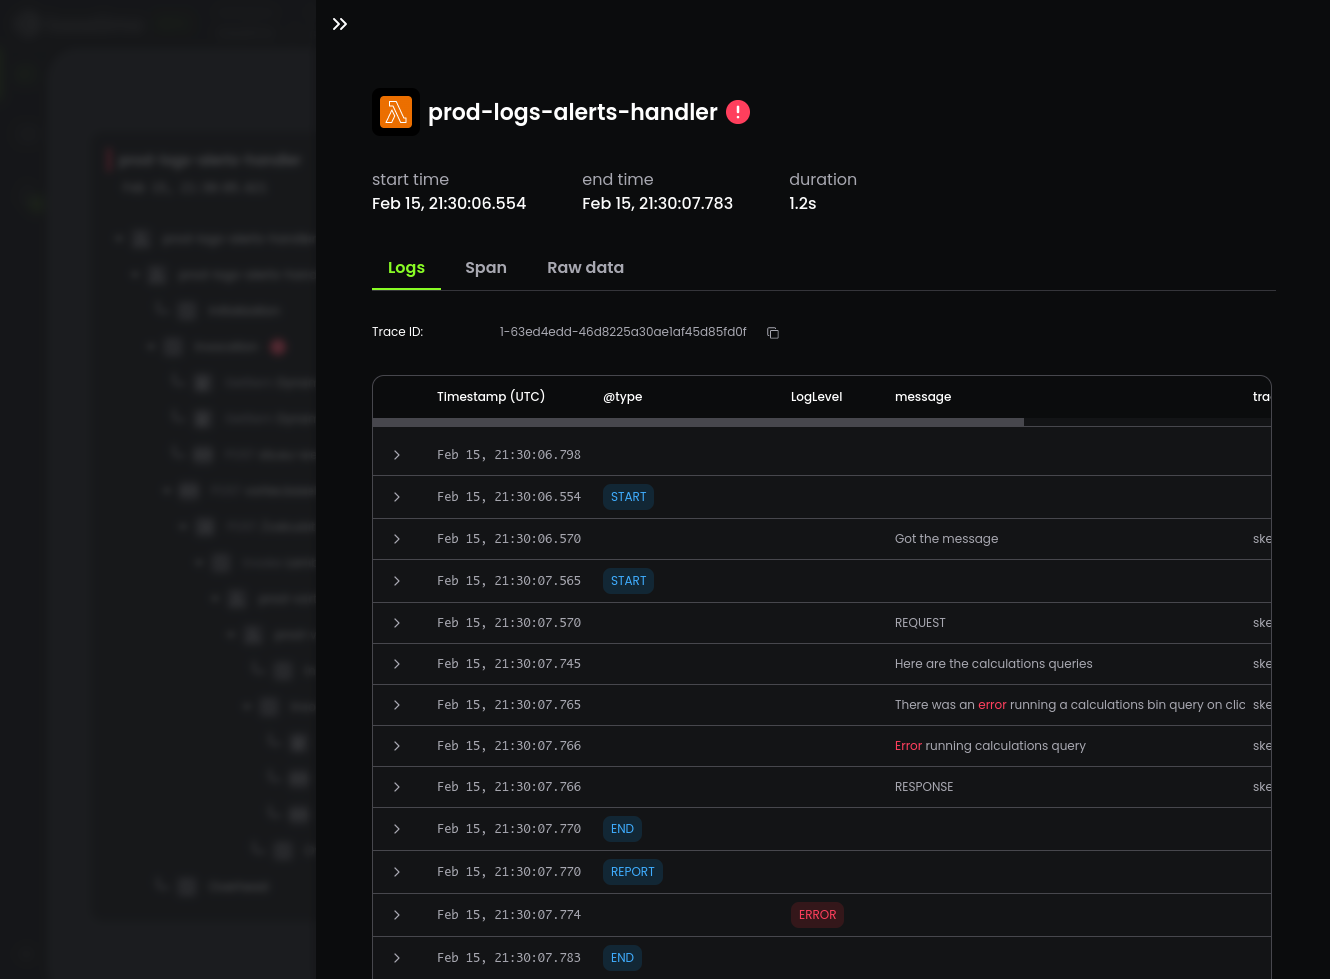
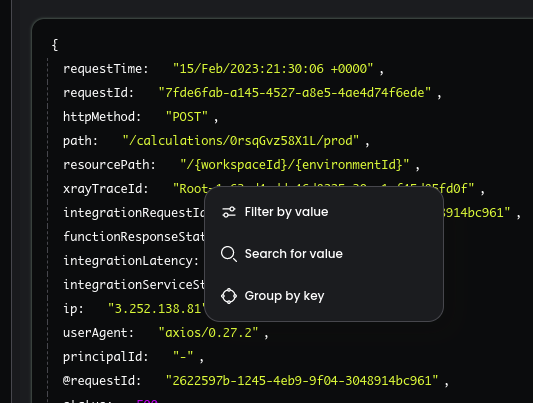
So what's the best part? You can refine your query to further drill down on your data to better understand the behaviour of your systems right from the logs view.
Getting Started
AWS X-Ray Instrumentation
Are you already using Baselime? No need to do anything at all, your traces are automatically captured from your AWS account, and your CloudWatch logs are correlated accordingly.
If you're not on Baselime yet, sign up here and start using the tracing data you already collect.
OpenTelemetry
If your code is already instrumented with OpenTelemetry, you're in luck because you can start sending us your tracing data today.
Otherwise, you can use the Baselime lightweight OTel tracer for Node.js that we specifically built to be as lightweight as possible for AWS Lambda.
Check our docs for more details.
What's Next?
We've been drinking our own champagne for the past few months, using Baselime tracing to improve the performance and reliability of our serverless architecture. We'll share more details on that, best practices for instrumenting your code with OTel and X-Ray, and the best ways to make use of your tracing data. Join other devs in our community to be the first one to know.
Try it Yourself
As of today, tracing is available in Beta to all our users and across all our plans. Sign up today, connect your AWS account, and discover what your telemetry data can tell you about your architecture.