We're excited to launch support for Cloudflare Workers and Cloudflare Pages. Baselime now supports both logs and distributed tracing for your applications deployed on Cloudflare.
The Baselime Cloudflare integration automatically captures logs from your Cloudflare Workers (using Logpush) and enables you to instrument your application with distributed tracing using OpenTelemetry or using the Baselime Node.js Edge Logger. With minimal code changes, Baselime covers:
- Full-text: search and match regular expressions across your logs and traces
- Real-time error tracking: be the first one to know about errors in your apps
- Alerting: create alerts from metrics derived from your logs and traces
- Pre-defined and custom dashboards to visualise your data and traffic
- Logs Live Tail, both in the Baselime console and using the Baselime CLI
- Service Discovery to accelerate troubleshooting
- Fast complex queries across your logs
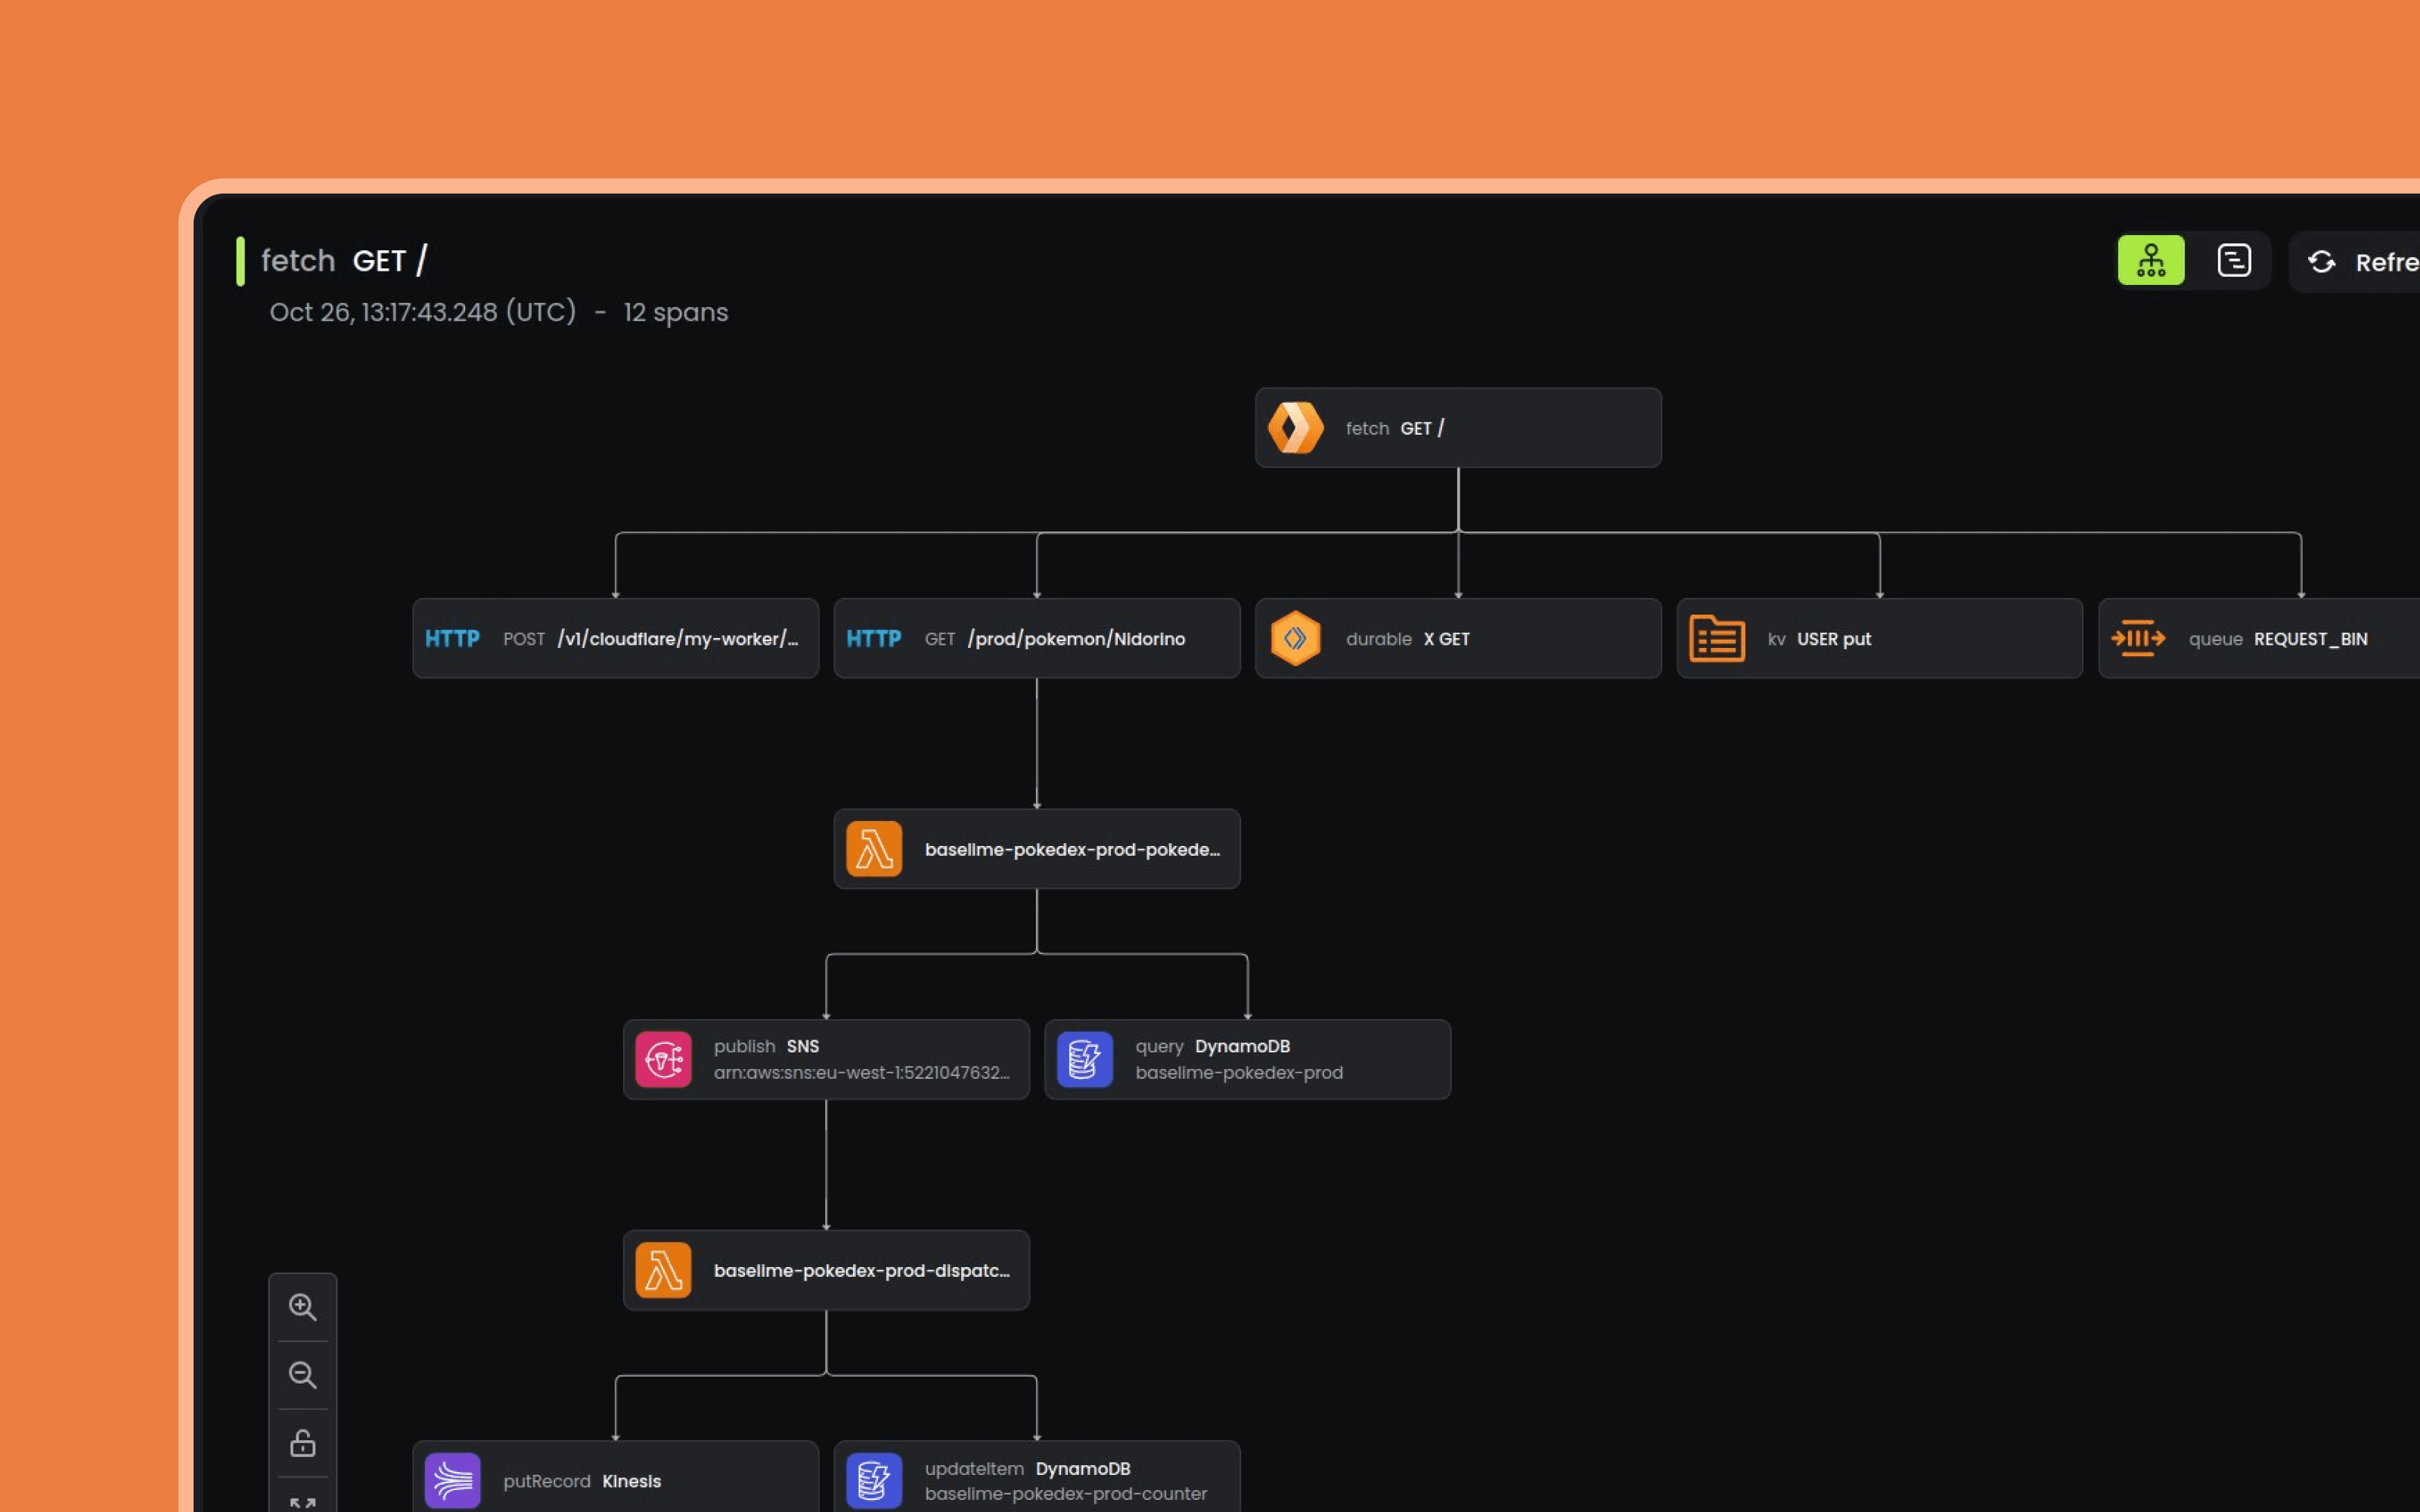
Baselime's distributed tracing for applications deployed on Cloudflare covers all major Cloudflare services such as KV, Durable Objects and more.
Application Logs
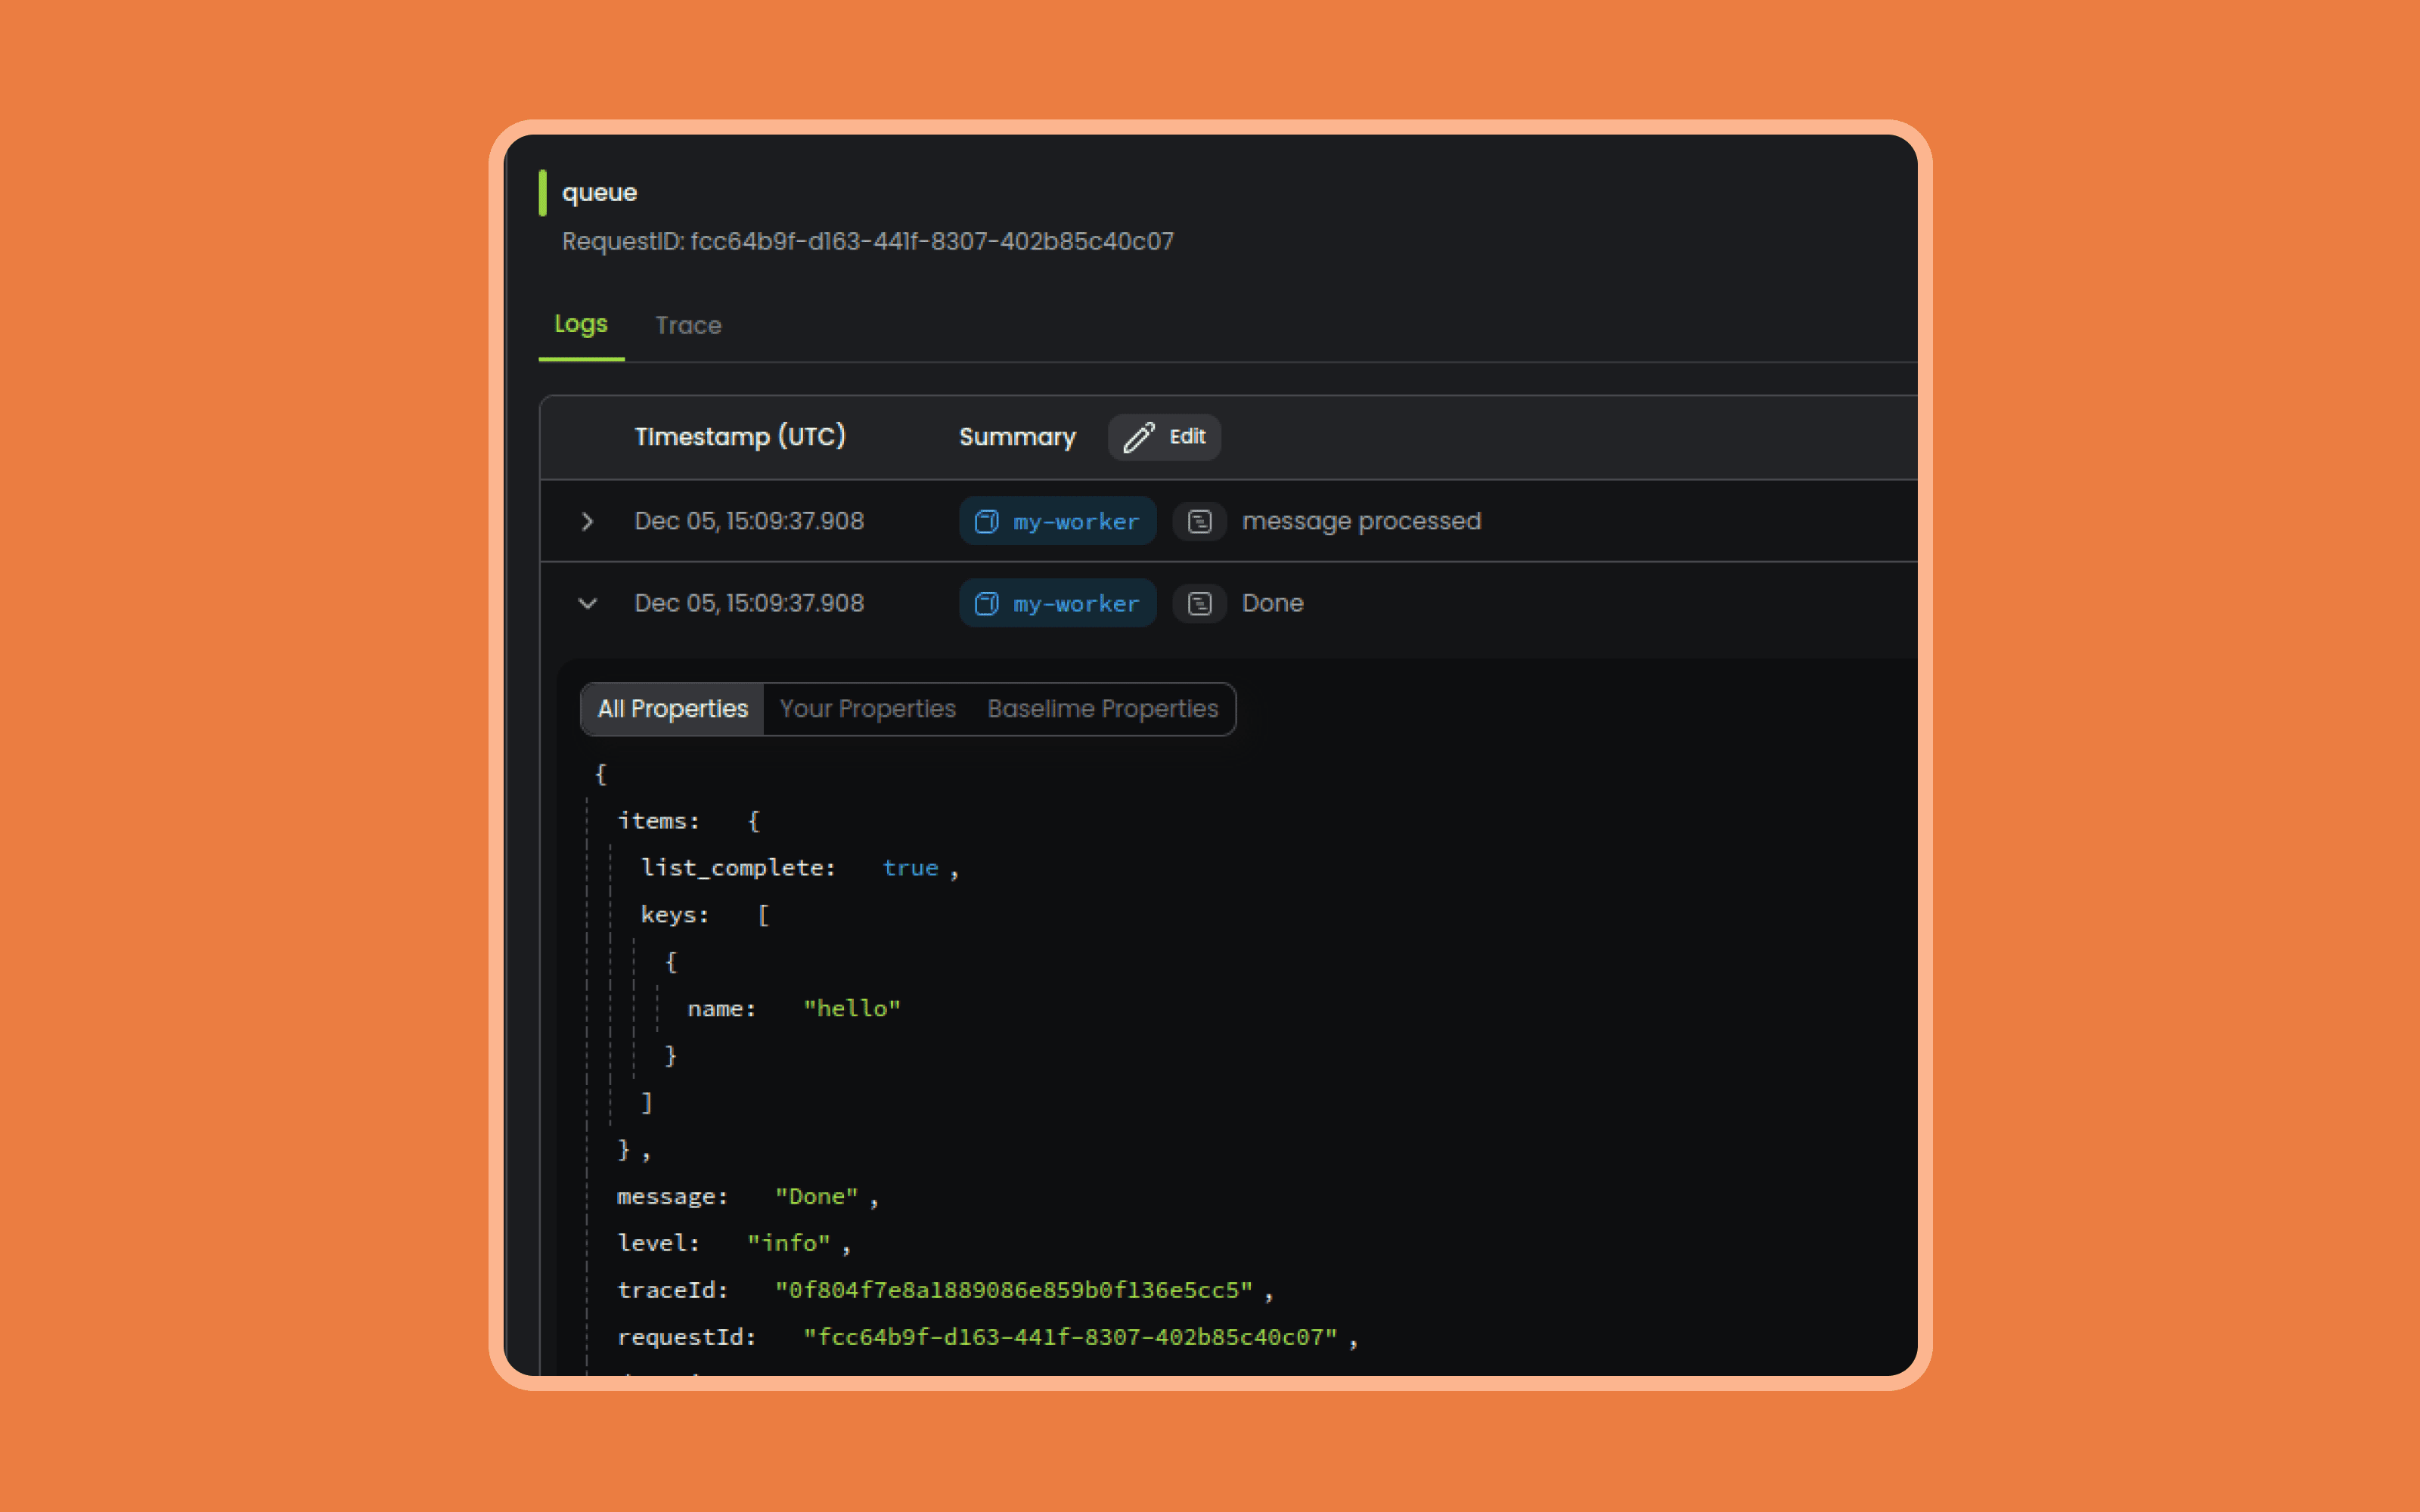
Once you integrate Baselime in your Cloudflare account (or install the Baselime Edge Logger), logs from your Cloudlare Workers stream into Baselime, where you can search, query and analyse your logs across any dimension.
Baselime automatically groups your logs per request and captures performance metrics such as duration. You can view the logs for a single request in isolation to investigate a specific issue, or query across multiple requests or routes to identify trends.
Distributed Tracing with OpenTelemetry
In addition to logging, Baselime enables you to observe your Cloudflare application with distributed tracing using OpenTelemetry. Using the otel-cf-workers library, you can instrument your applications with OpenTelemetry
import { instrument, ResolveConfigFn } from '@microlabs/otel-cf-workers'

export interface Env {
    BASELIME_API_KEY: string
    SERVICE_NAME: string
}

const handler = {
    async fetch(request: Request, env: Env, ctx: ExecutionContext): Promise<Response> {
        // your cloudflare worker code
    },
}

const config: ResolveConfigFn = (env: Env, _trigger) => {
    return {
        exporter: {
            url: 'https://otel.baselime.io/v1',
            headers: { 'x-api-key': env.BASELIME_API_KEY },
        },
        service: { name: env.SERVICE_NAME },
    }
}

export default instrument(handler, config)
compatibility_flags = [ "nodejs_compat" ]
For the full setup, refer to our docs.
Once you have instrumented your application, you can view, search, and query your logs in the Baselime console.
Automatic Error Tracking
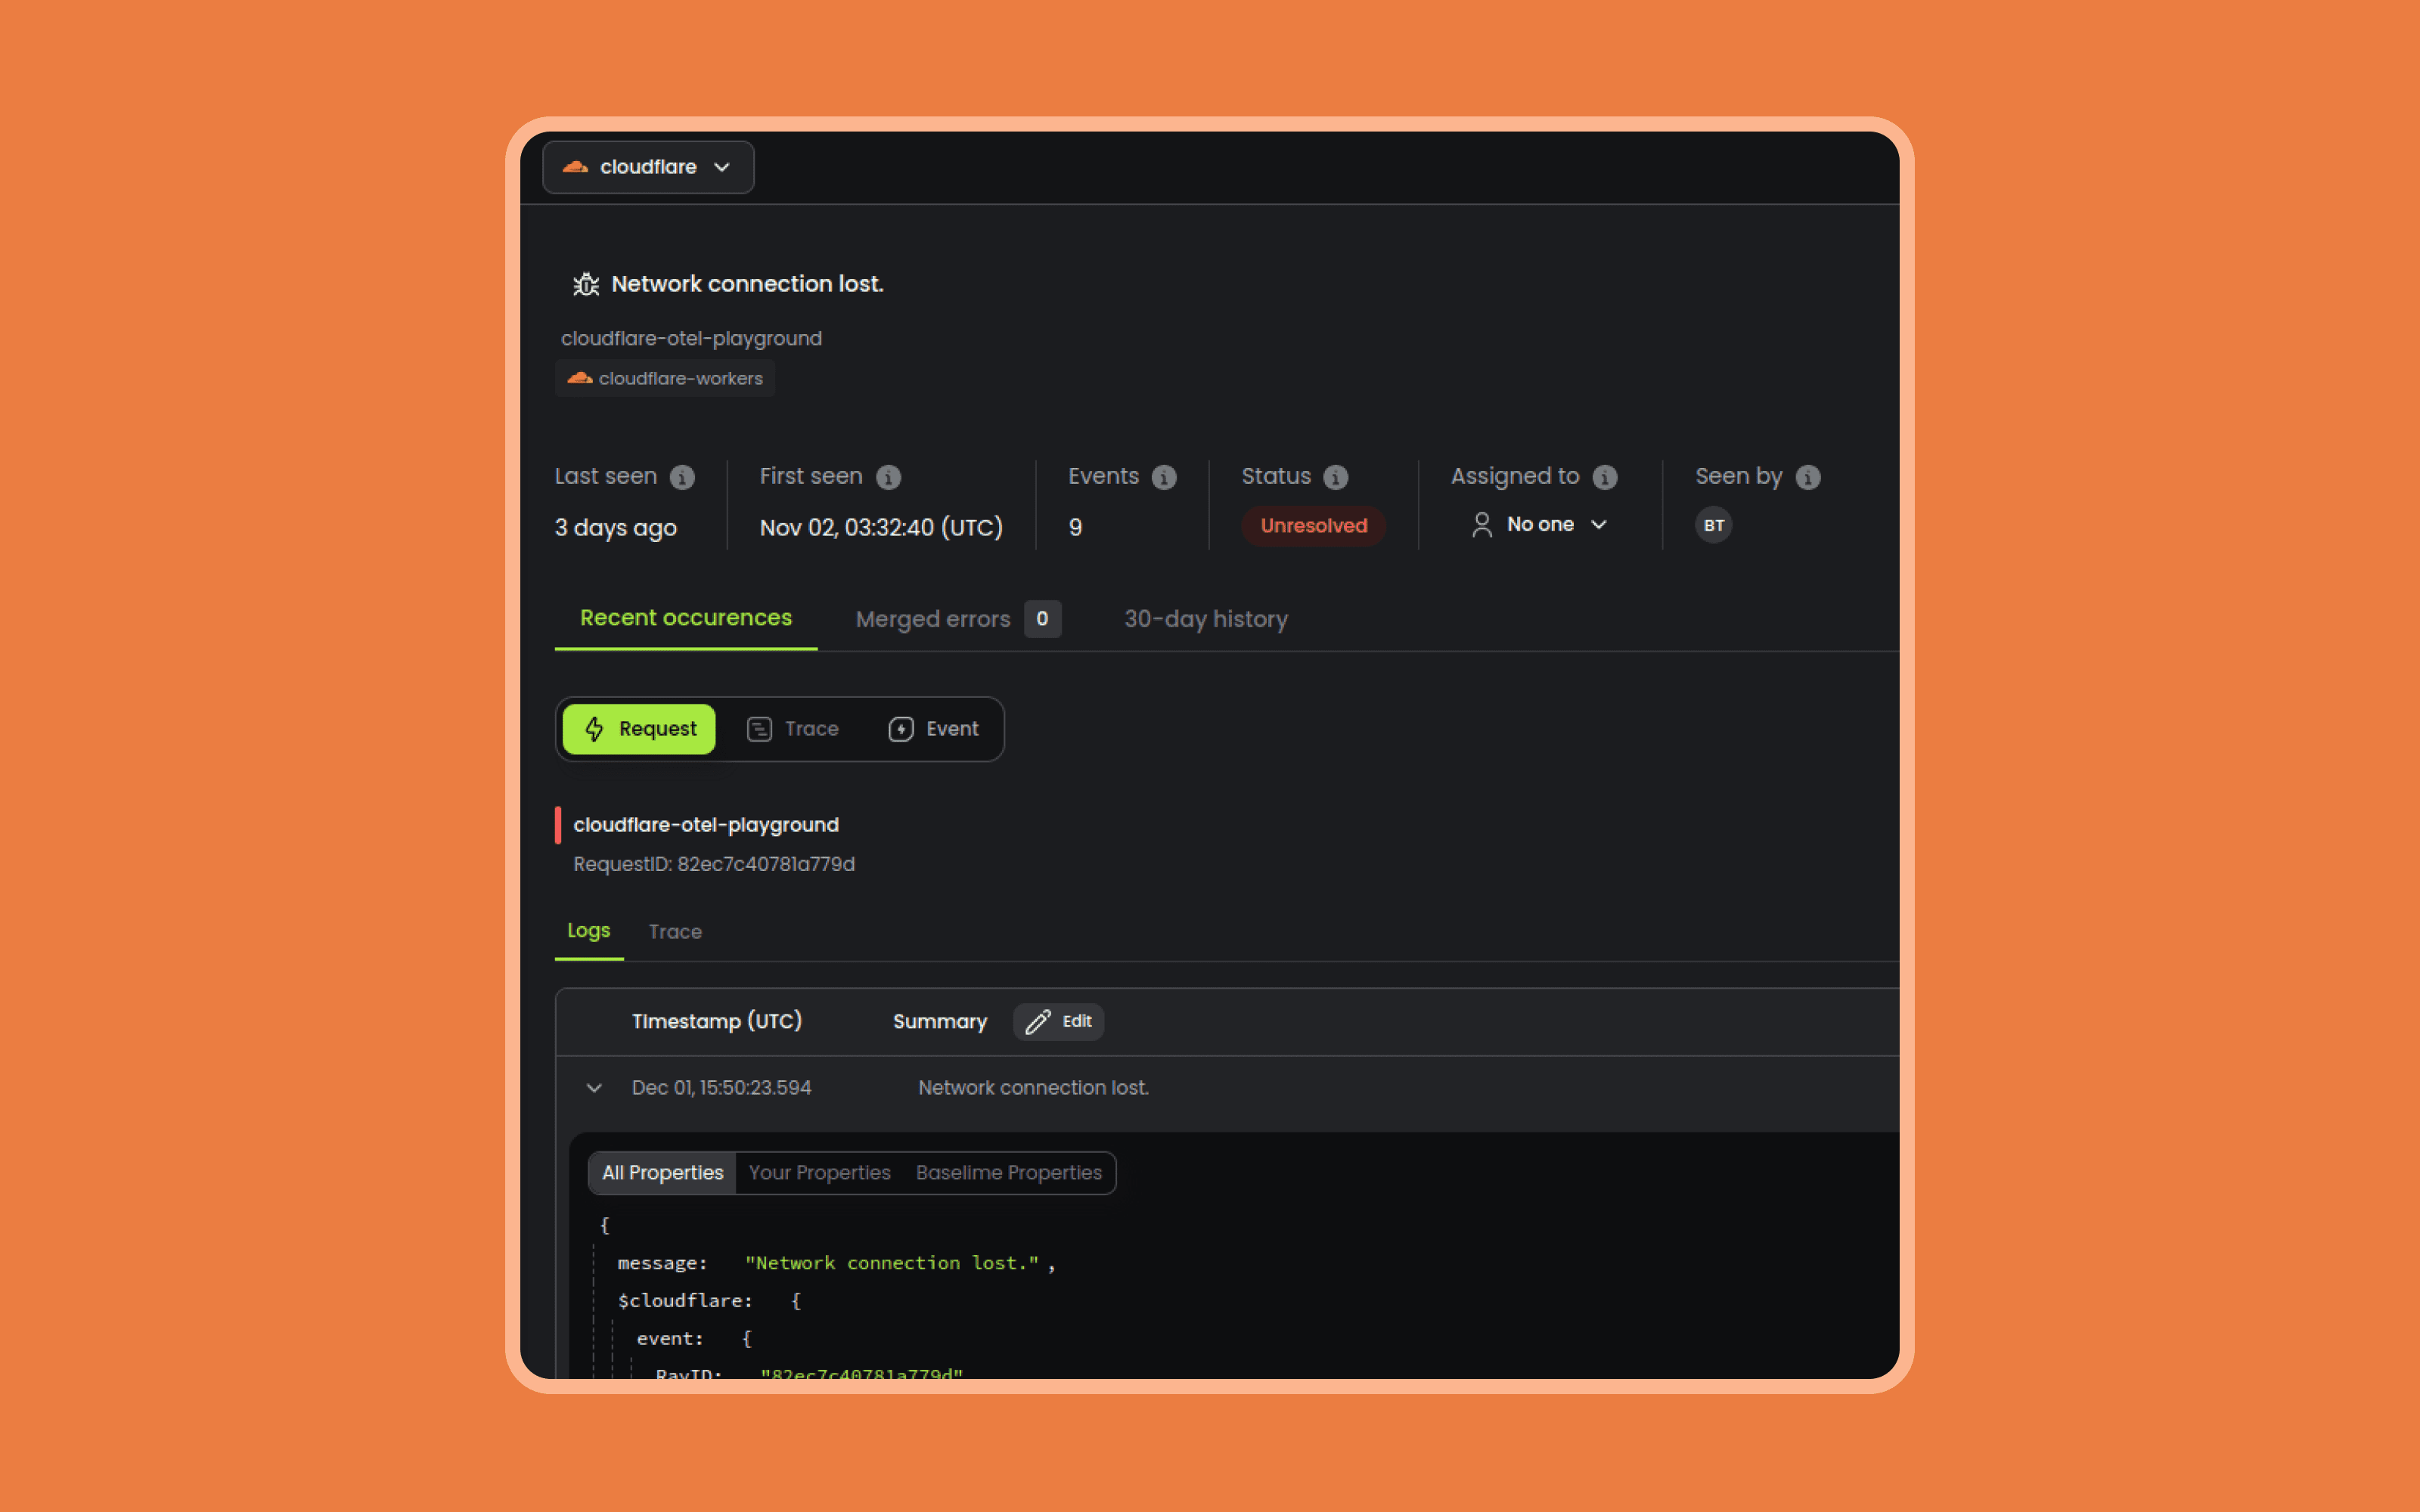
Baselime automatically tracks errors from your applications, at no additional cost. When a new error is detected in your stack for the first time, we send you a notification (Slack or email) and we keep track of the error for every subsequent occurrence.
Dashboards
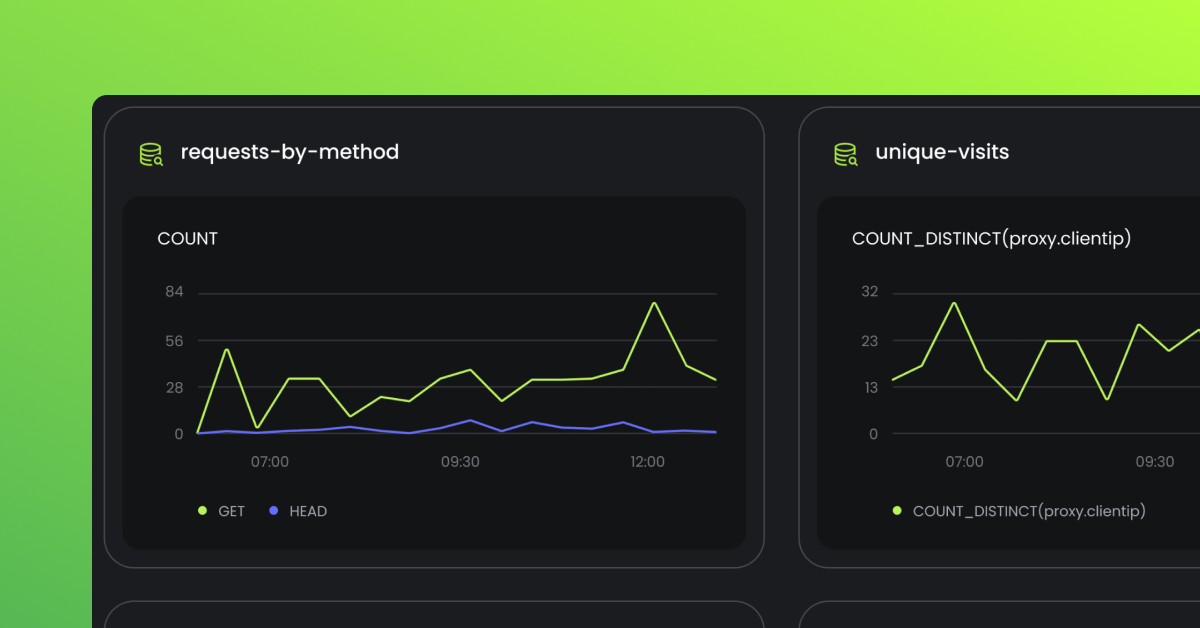
We built our Cloudlfare template dashboard to showcase key performance metrics across your Cloudflare applications. This dashboard enables you to quickly track error rate per route, slow routes or popular pages.
This dashboard is only a starting point; from here you can dig deeper into the data with the Baselime “Investigate” capabilities. “Investigate” enables you to go right from noticing signs that something is not quite right, to querying your logs or traces to understand exactly why.
What's Next?
This integration marks just the beginning of our journey with Cloudflare. We're committed to continuously enhancing our observability tools to keep pace with the evolving needs of modern web applications.
Over the next few weeks we aim to release:
- A novel interface to explore your traces, like anything you've seen before
- AI Capabilities (this is coming super soon)
Explore our new observability features for Cloudflare Workers and Pages. Connect with us on Twitter or join our community to share your experiences and suggestions. Your feedback is crucial for us to improve and evolve our services.
