
I deployed my first serverless function in 2017 and I knew right there: this is the way all cloud-based software will be built in the future. I went right in and built every single project with serverless functions and databases. I even introduced it at work, praising the benefits to everyone who would hear me. I was that annoying person excited about shiny new tech.
I had missed one thing: observability. Observing serverless applications is a pain. Observability vendors (including myself) will try to convince you it’s not, but it is.
Due to their stateless, ephemeral nature, serverless applications are a mess to observe with standard monitoring approaches. Investigating bugs typically turns into crime scenes, piecing together data from multiple sources, all to get a blurry image of the root cause of the issue.
It was so hard to debug serverless applications I literally quit my job and decided that if nobody was going to solve this, I will.
What is serverless?
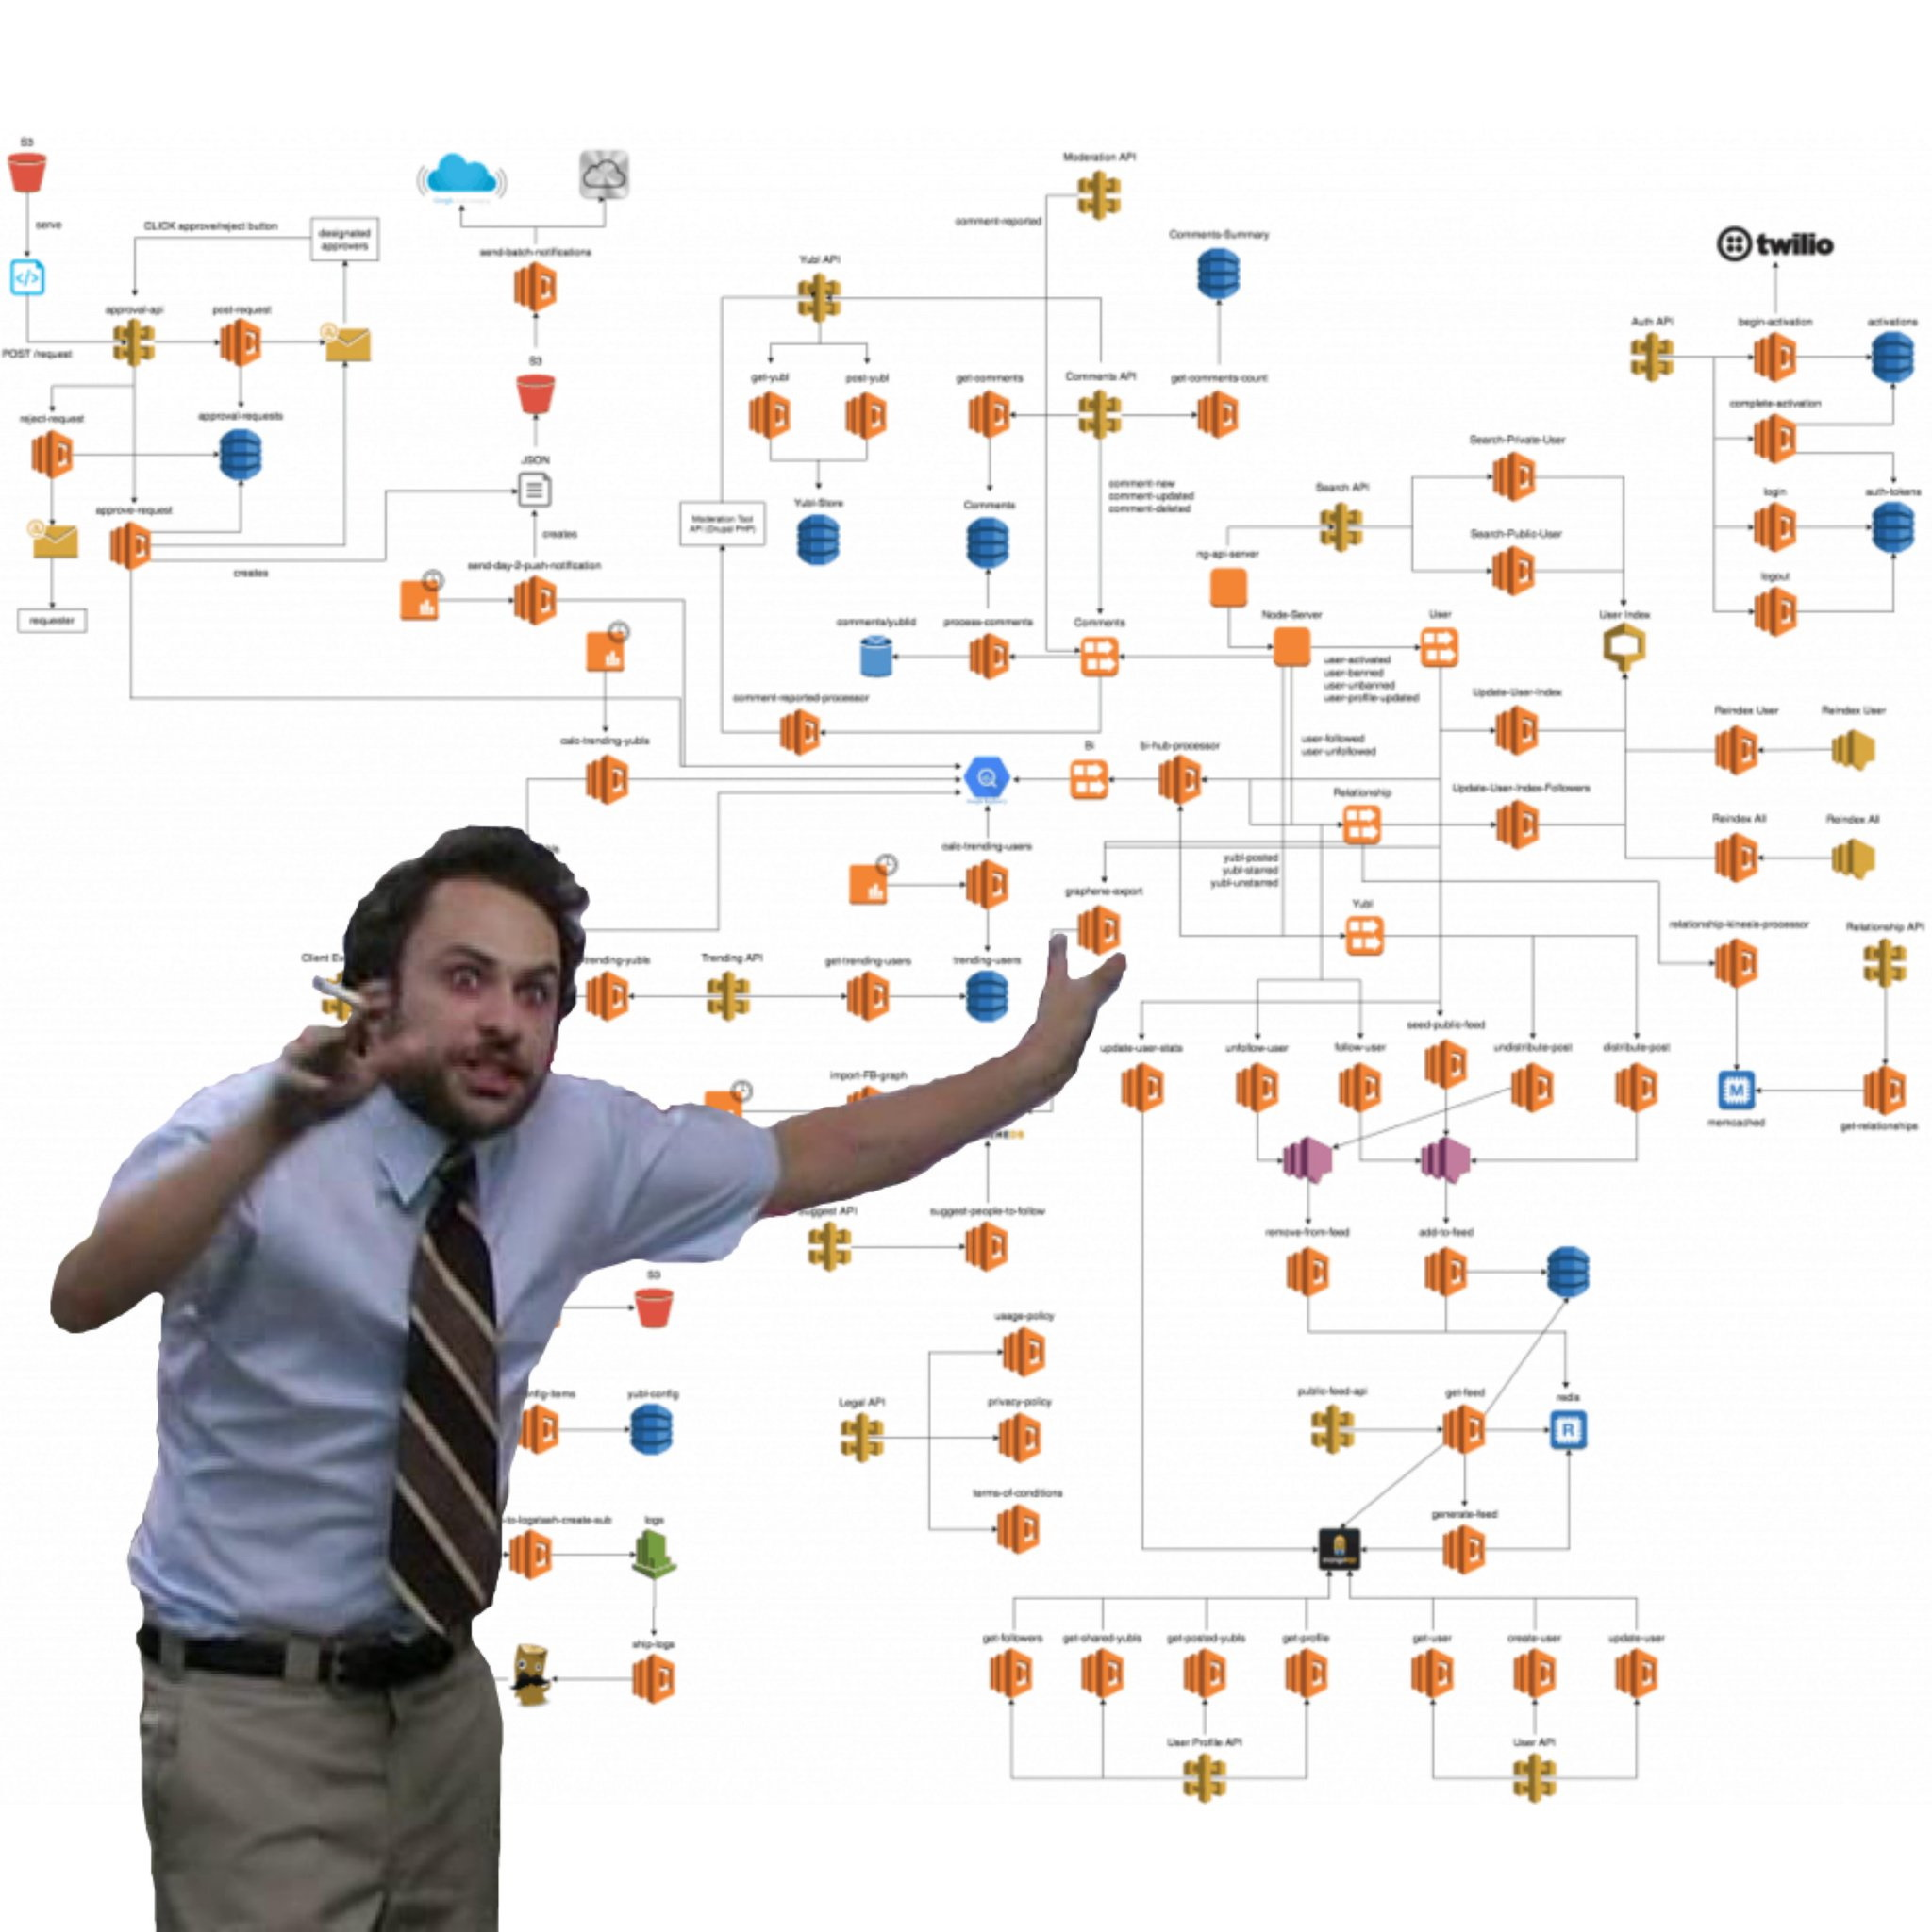
Let’s start with some history. How did we get here? How did we get to the point where when I received I customer support ticket, I had absolutely no idea where to start looking? I had 2000 serverless functions talking to each other through HTTP calls, queues, notification systems, event buses, and database streams, all in a giant system that was impossible to map out.
It started with “microservices”.
Microservices
Do you remember when around 2010 everything was about microservices and web-scale?
That’s when we collectively decided that microservices were the answer to everything.
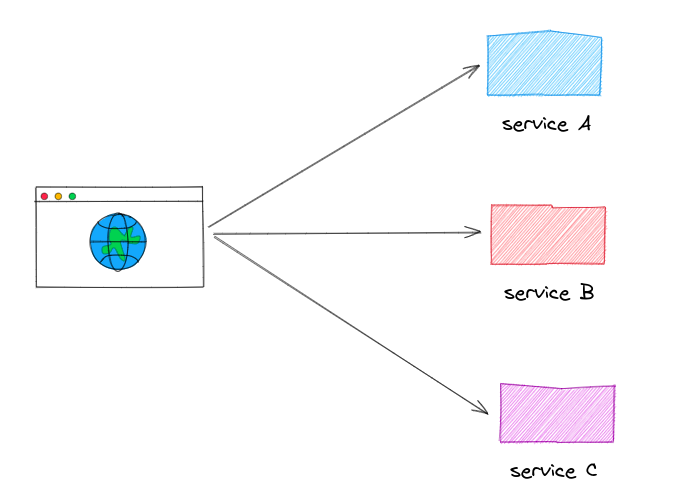
I could write an academic definition of microservices here, but we all know what microservices are: a bunch of small, independed services that communicate with each other over the network. Each services is supposed to do one thing only and should be deployed, scaled and updated independently of the other services. The benefits of microservices include improved scalability, fault tolerance and resilience, as well as easier deployment and maintenance.
What are the downsides of microservices? Nobody cared back then. It was “web-scale” or nothing.
Serverless
In 2014, AWS launched AWS Lambda. It wasn’t called serverless yet, but the foundations were there. Stop worrying about provisioning capacity for your servers. Send us an event and we will handle everything for you, run your code, and send you the response back. What a beautiful idea!
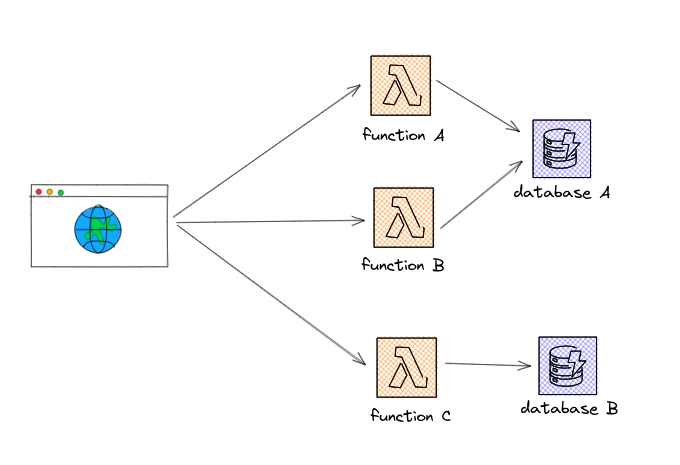
The serverless model is frankly quite beautiful: an event-driven compute model where application logic is broken down into small functions that can be executed independently. Each function is triggered by an event, such as an API request, a change in a database, or a message from a message queue. Each function can scale independently from the rest of the architecture, giving you a level of control and granularity you could only dream of before.
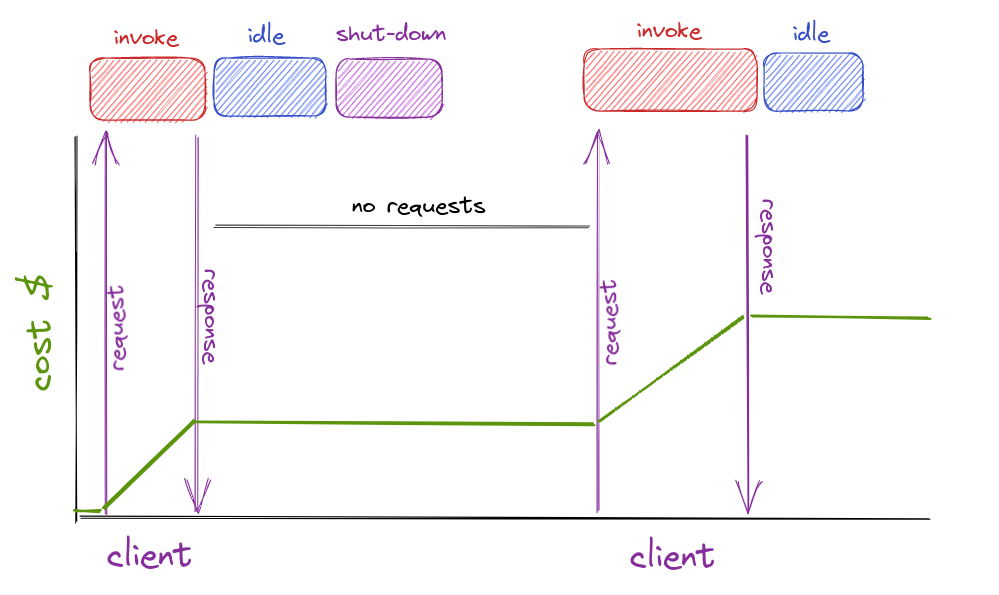
The pricing model is based on the number of requests and their execution duration. You can write and deploy individual functions performing a well-defined task as a response to an event. Once the event is triggered, the cloud provider spins up a new instance of the function, runs the code the you wrote and returns the result. And you pay for only the time your function was actually invoked, instead of paying for the underlying infrastructure for idle times.
If your application has an unpredictable or variable load profile, this is the way you want to be billed.
I was drawn to the ephemeral, auto-scaling and pricing model of serverless. It enabled me and the company I was working for to accelerate development cycles, as we didn’t have to provision, troubleshoot or maintain any servers. I had forgotten what a memory leak was.
But there was a problem.
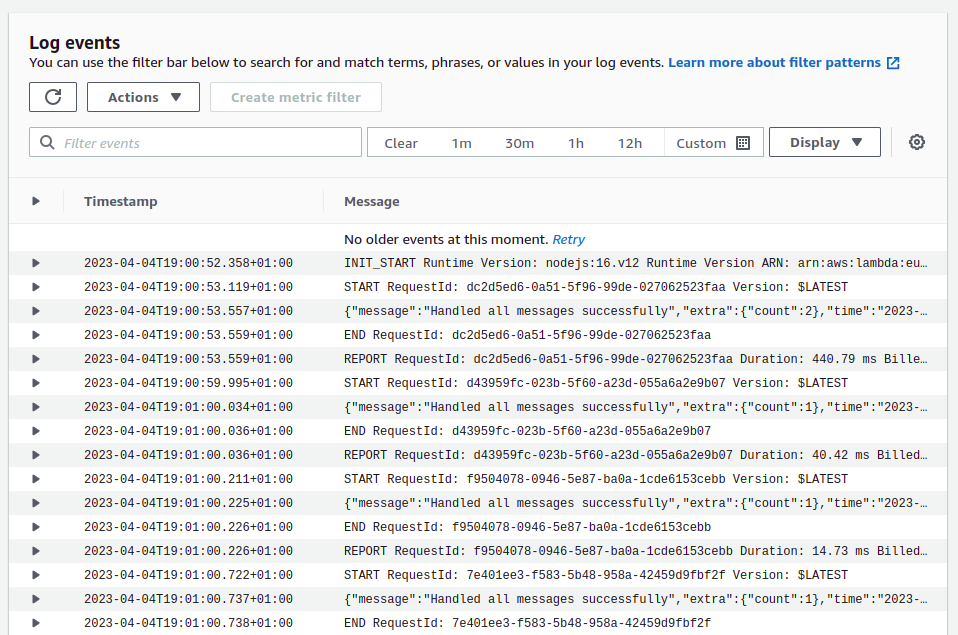
I had absolutely no way of reliably and easily collecting and aggregating data about the behaviour of my applications in production. I used to have a system piping logs from my containers and shipping them to a brittle but functioning ELK stack. Those days were over. I was now pigeonholed into 100s of Amazon CloudWatch log groups and log streams with disconnected logs that I had to somehow manually piece together. And you don’t want to be doing this during a production outage.
I needed an observability solution.
What is Observability?
The common definition of observability is:
“Observability is the ability to understand and measure the internal state of a system based on its external outputs, achieved through instrumentation.”
A lot of words to say you should be able to know why prod is down, or why a user is experiencing high latencies quickly.
Imagine you are a developer responsible for maintaining a large e-commerce application that experiences frequent outages and performance issues. You have a hard time pinpointing the root cause of these issues because you lack visibility into the internal state of the application. You are unable to tell what happens to a customer's order when it goes through multiple services, and you struggle to identify which component is causing the slowdown. This is where observability comes in.
Observability is like turning on the lights in a dark room. Without it, you flying blind, struggling to diagnose issues and maintain the health of the system. Observability provides the necessary tools and techniques to gain visibility into the system's internal workings, enabling you to diagnose issues and optimize performance.
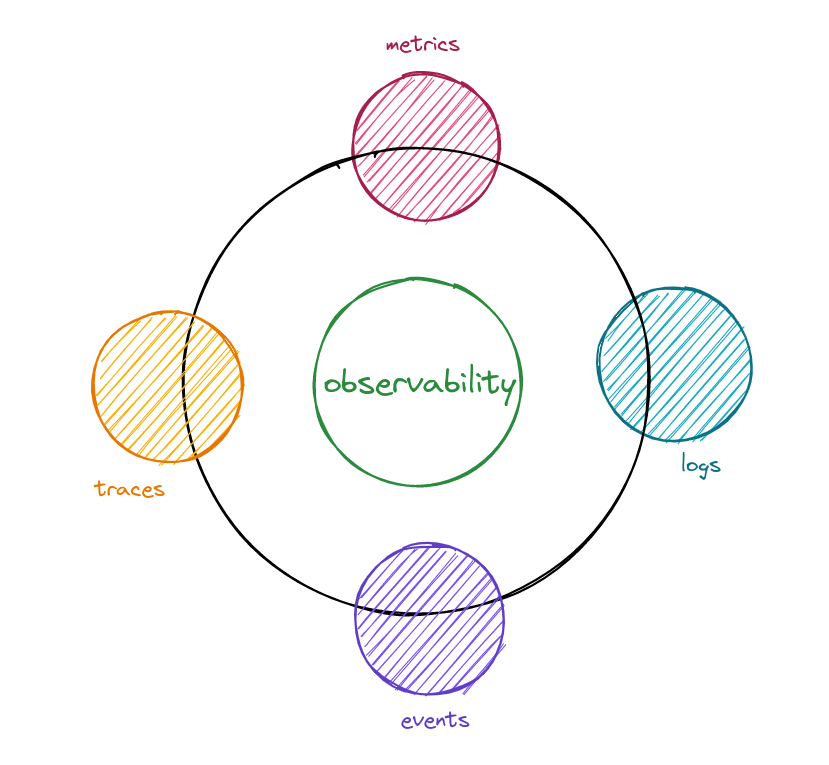
Telemetry data is at the heart of observability. You need to instrument your systems with various tools that collect and analyze telemetry data. This data may include logs, metrics, traces, events, and all other pieces of information that can help you diagnose the root cause of issues fast.
Logs
Everybody knows how to log. It’s the first thing we learn when we learn programming: print “Hello, World!” to the console.
A log is a note you leave in your codebase for your future self or your team, such that they can know what happened at runtime.
In most modern distributed cloud-based systems, logs are the only way to actually know what the heck is going on in production. You pass a unique transaction ID through all the services that a specific call touches and you log it alongside your log message. If you’re relying on logs and you’re not doing this, I sincerely don’t know how you live.
Once you start propagating request IDs across, the next step is to ditch the text-based logs and adopt structured logs, where each log line is a structured JSON blob that you print to the standard output. The additional metadata added to the JSON blob can help during debugging, providing the rich context that is absolutely necessary to understand the system behaviour.
Once you’ve mastered structured logging, canonical logs are the next natural evolution. With canonical logs, you print a single log line at the end of each and every request that captures the key vitals of the request (the path, the response status code, the duration, etc.) alongside any metadata that is relevant to this specific request. Canonical logs enable you to quickly explore your data without the need for joins and complex queries.
Traces
Instead of doing all the manual work to get to canonical logs, you can use distributed tracing.
Distributed tracing is a technique used to track the path of a request or event as it travels through a complex distributed system with multiple interconnected services.
Distributed tracing automatically does all the work you would put into propagating trace ID across the stack and printing JSON formatted logs. It captures and correlates data from each service involved in processing a request, including data for dependencies, protocols and latencies.
Let’s look at a typical distributed application and the trace of a request flowing through it.

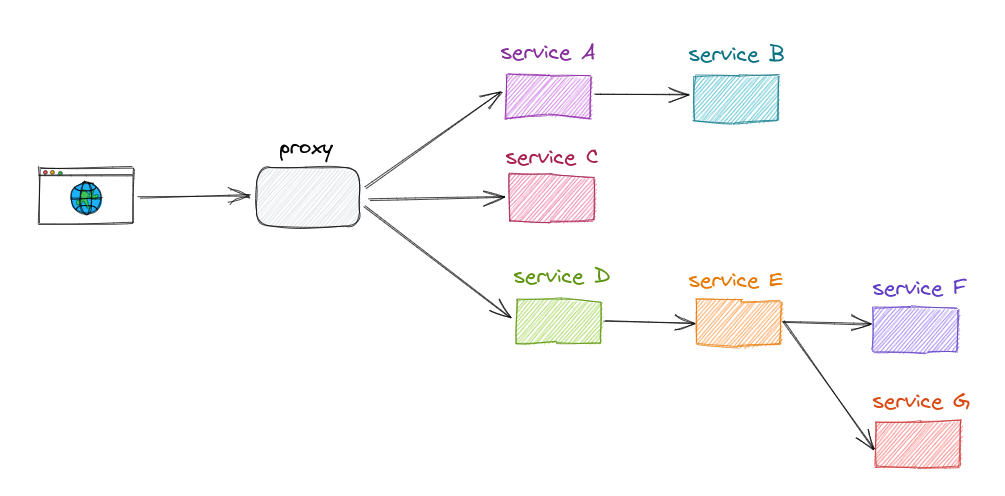
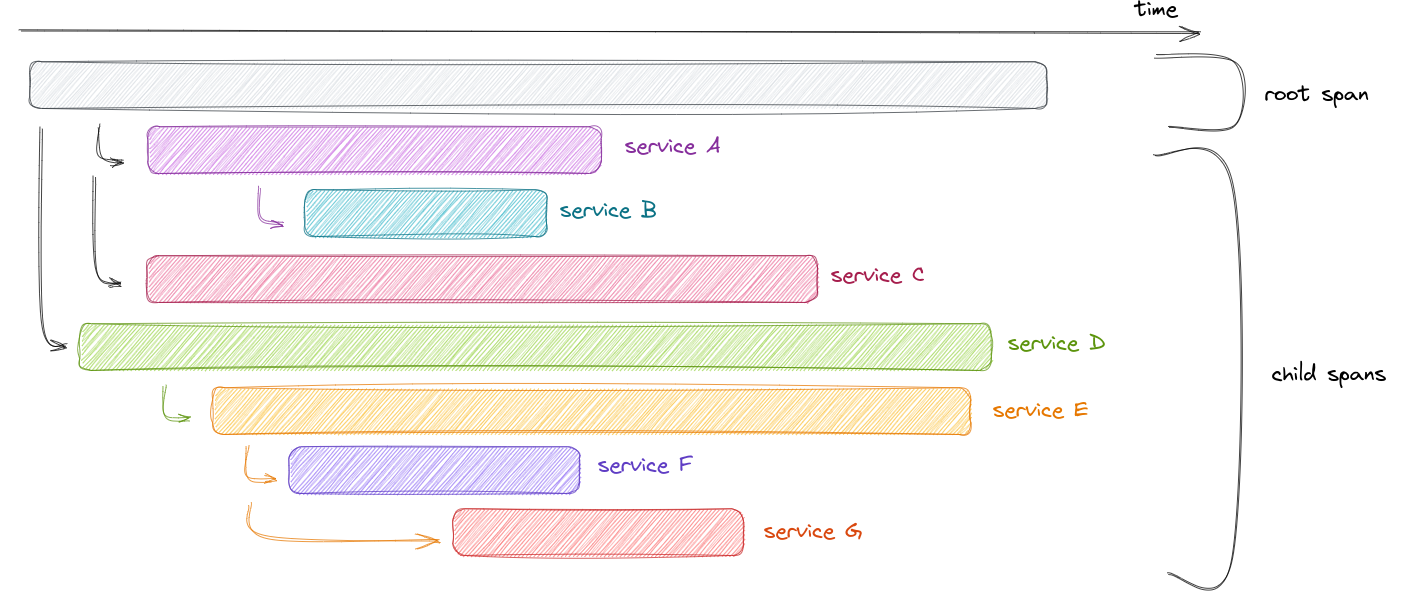
A trace consists of multiple components, each referred to as a span. A span represents a unit of work, its start time and its associated processing time.
From the trace above, it is cleat that calls to service F and service G can be made in parallel. They are independent but made sequentially. This optimisation will lead to a faster response to the client and ultimately happier customers. It’s possible to get this same insight from logs, but who wants to be scanning through timestamps individually?
Why is this such a mess for serverless?
Serverless observability is confusing.
- Do you want nice logs? That’s too bad, Amazon CloudWatch will create a new log group and log stream as it pleases, and it’s up to you to figure it out.
- Do you want distributed tracing? That’s 800ms more in cold starts. Enjoy!
- Do you want to bypass the Amazon CloudWatch tax? It’s possible, but be ready for higher latencies.
All the good things about serverless: no servers to manage, no infrastructure to provision, and stateless and ephemeral computing; all get in the way of instrumenting and building observable systems.
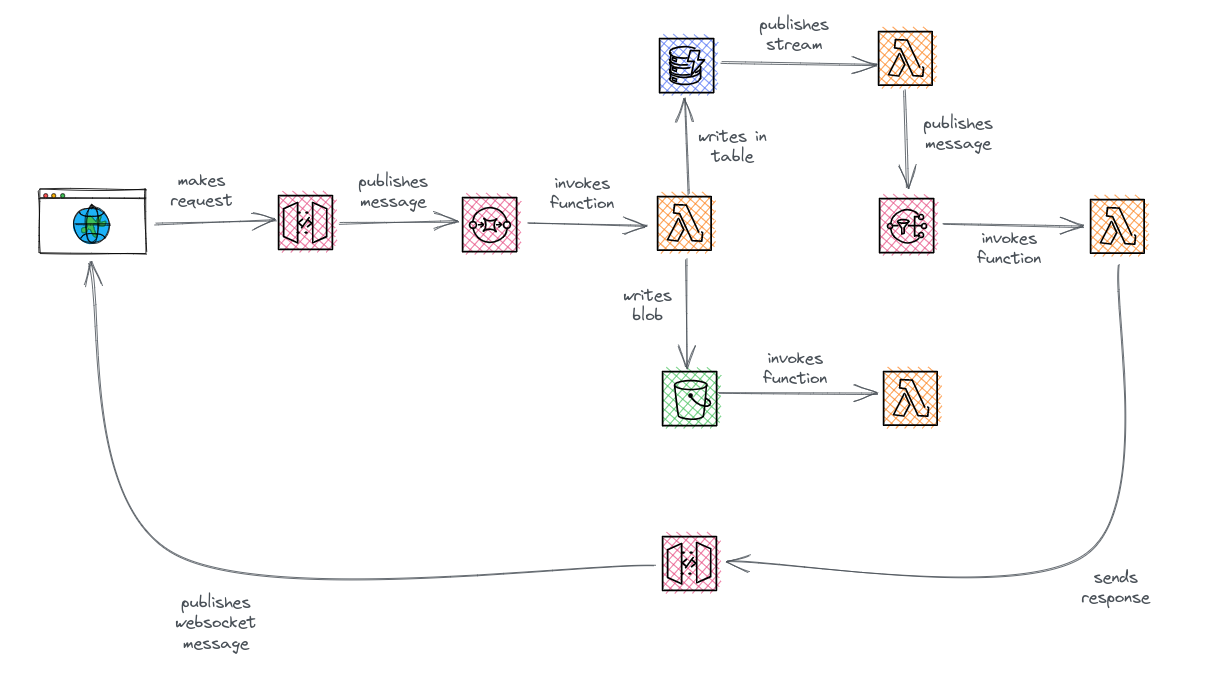
The event-driven nature of serverless applications makes the observability challenge even worse. In contrast to traditional HTTP-based architectures, serverless functions very often communicate with each other through event brokers like message queues, event buses or event streams, introducing new complexities, such as asynchronous processing, message ordering, and event aggregation. The non-linear path of event-driven architectures makes it more difficult to trace requests, especially when multiple services consume and produce events asynchronously.
All this reduces the visibility you have in your application, making it harder to troubleshoot issues when they inevitably occur.
There’s a better way
There’s no silver bullet when it comes to serverless observability. I am Baselime for two years now to make improve the developer experience of observability for serverless architectures.
We make it as easy as possible for you, but if you expect a magical solution, with no instrumentation, no code changes, no additional cost, and it magically works, it doesn’t exist.
Instead we can make the hard things in observability as easy as possible such that you can focus on building great apps.
- Distributed tracing with OpenTelemetry by adding a tag to your serverless functions, no fiddling with libraries.
- Direct correlation between your logs and traces, such that you always have more context when diagnosing issues.
- High cardinality and dimensionality, everything is indexed by default, enabling you to search and query against anything.
- Automatic error tracking to let you know about issues before they impact your users.
- AI capabilities, which are like pairing with a senior software engineer everytime you're investigating an issue.
Our goal is to make serverless observability less of a pain, and enable you to detect, diagnose and resolve issues before they become problems.