Meet Tux
your Observability AI Copilot
Get a copilot that surfaces insights, debugs with you and recommends fixes in your codebase
Get a copilot that surfaces insights, debugs with you and recommends fixes in your codebase


Hey Tux! 👋 This transaction seems slow, can you please tell me more?

Tux gathers data about your trace, the correlated logs, details of your architecture and analyses it all
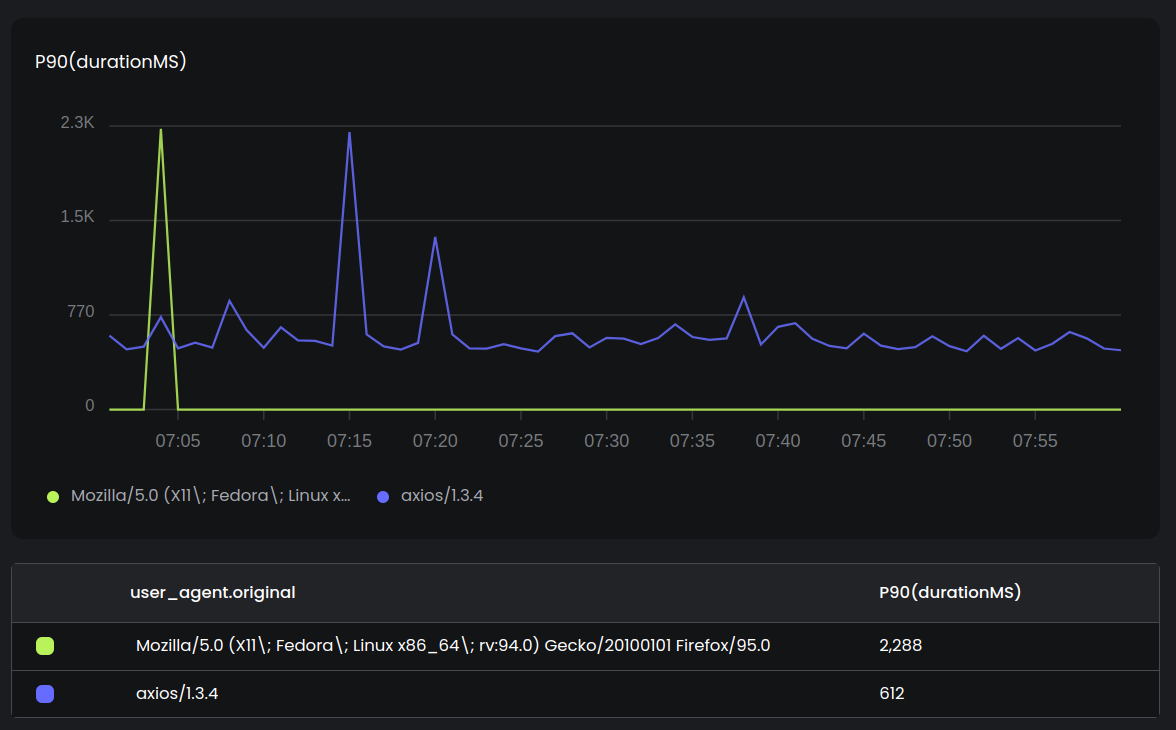
Sure! The duration of calls to fetch GET / have a P90 of 612ms but there are spikes up to 2288ms, especially for the Mozilla/5.0 (X11\; Fedora\; Linux x86_64\; rv:94.0) Gecko/20100101 Firefox/95.0 user agent.
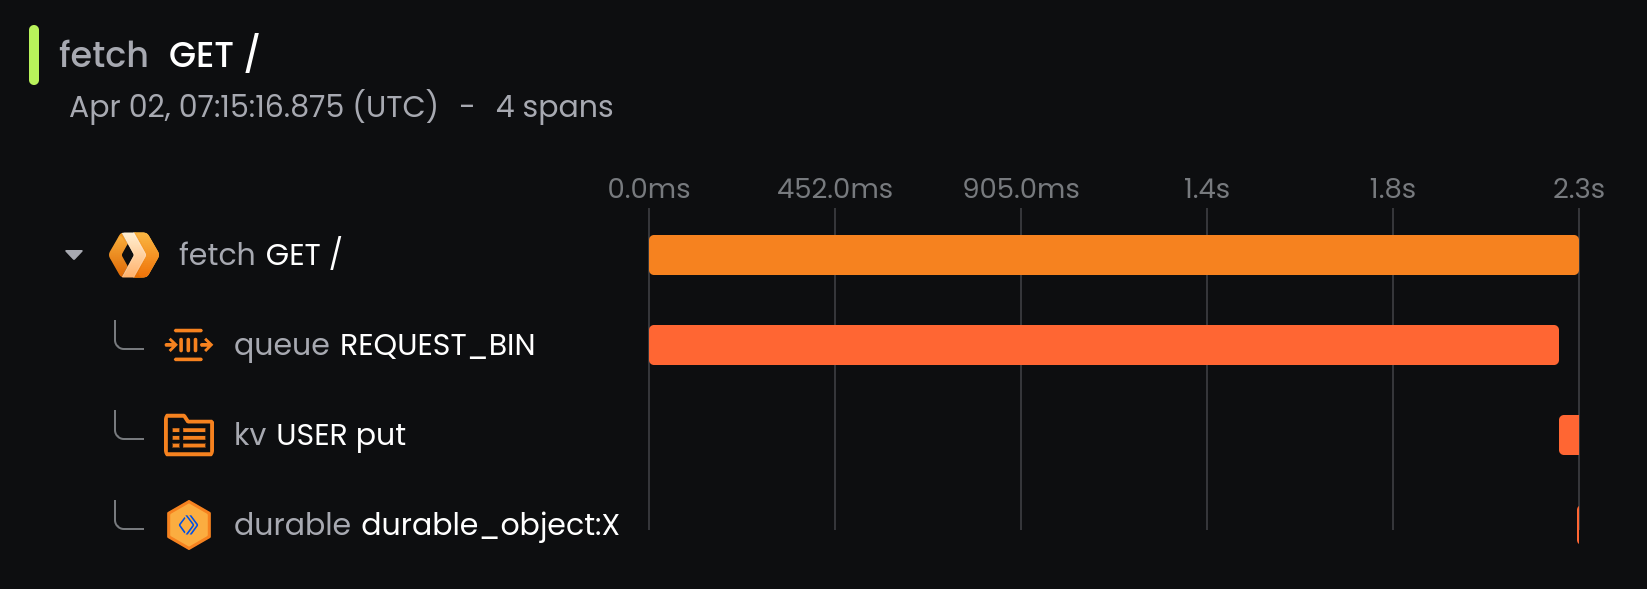
The duration of the specific trace you shared (traceId: 503eeeefad393e47a5caf295368a53b8) is 2262ms. This is quite high and is an outlier.

You can ask subsequent questions, or create alerts or dashboards, all within the chat with Tux
How can I improve this?
The added latency is mostly due to the call to queue REQUEST_BIN. Check the size of the payload you send to the queue. Large payloads typically lead to higher latencies.
Additionally, you could make I/O calls in parallel: queue REQUEST_BIN, kv USER put and durable durable_object:X could be in parallel instead of sequentially. The will reduce the latency of this transaction.
Ask Tux to help you troubleshoot from anywhere. Whether it's a request, a trace, or an reccuring error, Tux will surface insights to you.
Troubleshoot faster with Tux. Ask follow up questions to uncover the root cause of issues.
Share your findings with your team, ask them to join the conversation and investigate together, alongside Tux.
Get an AI copilot to help you debug and troubleshoot faster! It's free!
We use cookies to offer you a better browsing experience, analyze site traffic and personalize content. By using our site, you consent to our use of cookies.