
One of the questions I often get is “Boris, given Baselime supports both OTel and X-Ray, which one should I use?” My thoughts on this have evolved over time. As with everything in tech, the answer is “it depends…”
Today, I'm writing down my detailed thoughts and what to consider when choosing the solution that’ll work best for you and your team. We use both at Baselime and you’ll understand why.
OpenTelemetry: The Open Source Champ
What is OpenTelemetry?
OpenTelemetry is an open-source observability framework that enables you to collect, process, and export telemetry data from your applications.
Key Features of OpenTelemetry
- Vendor-Agnostic: OpenTelemetry doesn't tie you to a specific cloud provider or observability vendor. You can instrument your applications with OpenTelemetry and send your telemetry data to as many vendors as you want, or process and store it yourself. It's designed to work across different environments, ensuring vendor lock-in isn't an issue.
- Instrumentation Libraries: It provides instrumentation libraries for various languages, making it easier to instrument your applications. These libraries automatically generate trace and metric data.
- Pluggable Architecture: OpenTelemetry is built on a pluggable architecture, enabling you to integrate it with various observability backends, including popular ones like Prometheus, Jaeger, and Zipkin.
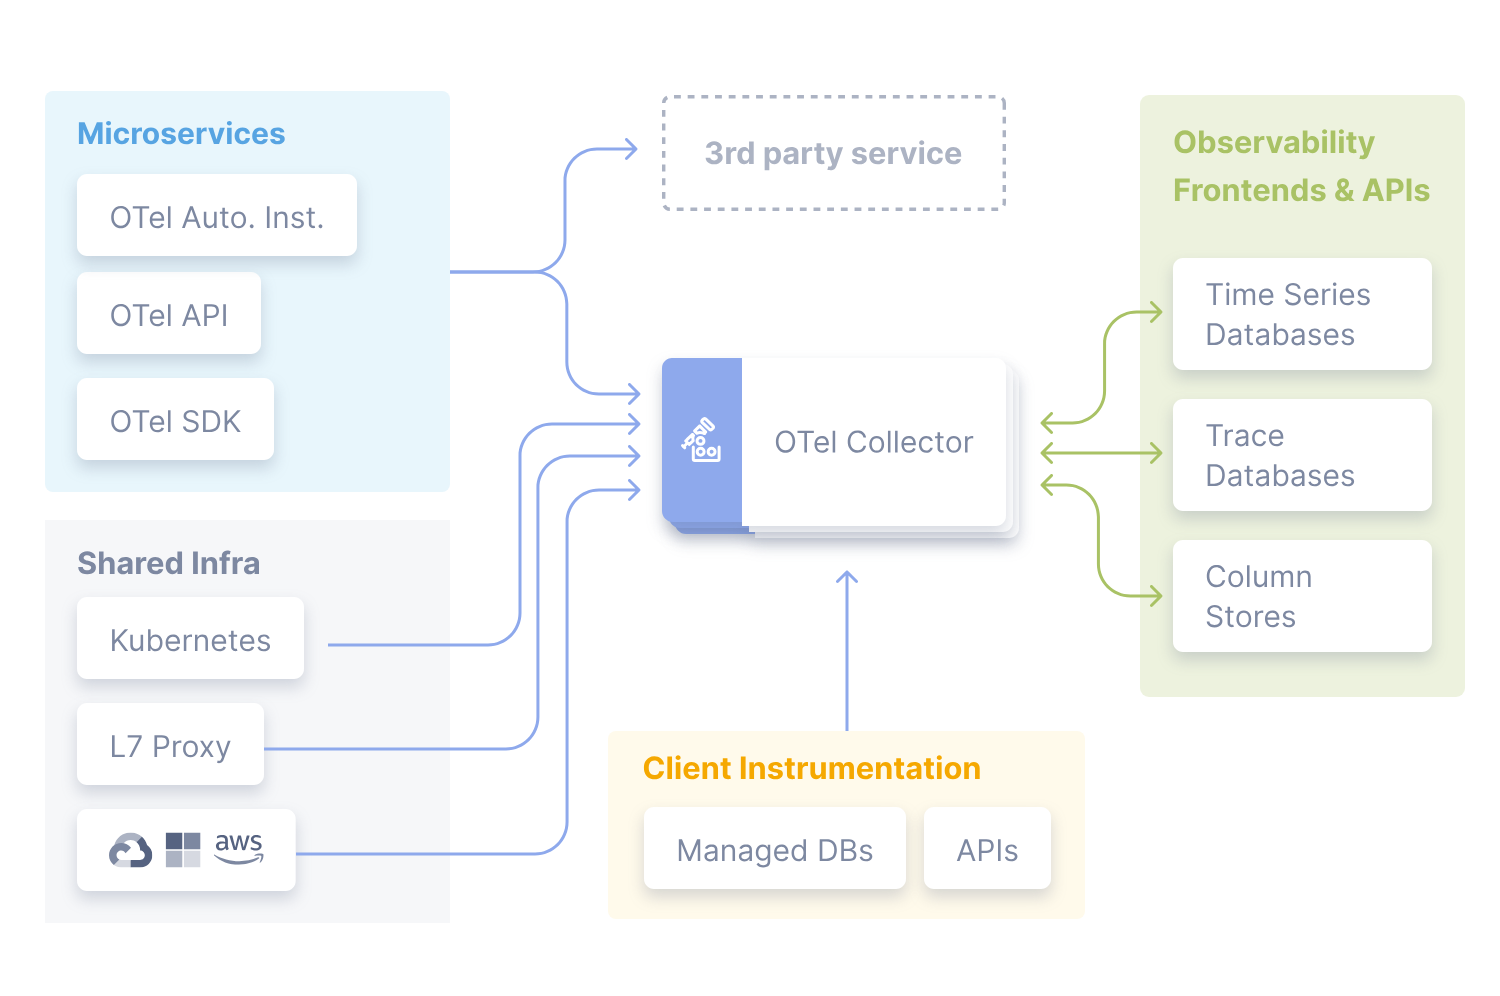
A Look at OpenTelemetry's Architecture
The OpenTelemetry architecture is based on three core components:
- APIs: These define the interfaces used for instrumentation. They offer a consistent way to add tracing and metrics to your code, regardless of the language you're using.
- SDKs: The SDKs implement the APIs and provide a straightforward way to instrument your code. They handle the heavy lifting of data collection.
- Collectors and Exporters: These components enable you to collect and send your telemetry data to various backends. Whether you're storing data on-premise, in your own cloud account or with an observability vendor, OpenTelemetry has you covered.
AWS X-Ray: AWS's Native Solution
What is AWS X-Ray?
AWS X-Ray is AWS's native distributed tracing service. It provides distributed tracing as requests travel through your application, enabling you to identify performance bottlenecks and troubleshoot issues effectively.
Key Features of AWS X-Ray
- Seamless AWS Integration: Being an AWS service, X-Ray seamlessly integrates with other AWS offerings, providing a unified observability experience for applications running in the AWS ecosystem.
- Service Maps: X-Ray generates service maps that visualize the interactions between various components of your application, making it easier to identify dependencies.
- Straightforward Sampling Options: You can control the amount of data you capture with customizable sampling rules, which helps manage costs and reduce overhead.
AWS X-Ray's Architecture
AWS X-Ray's architecture is more of a black-box approach compared to OpenTelemetry. You instrument your AWS resources, and X-Ray takes care of the rest.
Comparing OpenTelemetry and AWS X-Ray
When choosing between OpenTelemetry and AWS X-Ray for observability in your software stack, there are several key factors to consider. In this section, we'll delve deeper into the comparison, with a specific focus on different use cases and scenarios.
1. Multi-Language Support
OpenTelemetry: OpenTelemetry shines in terms of multi-language support. It provides instrumentation libraries for a wide range of programming languages, including Java, Python, Go, JavaScript/Node.js, .NET, and more. This extensive language coverage means that no matter what tech stack you're working with, you're likely to find appropriate libraries and resources to get started quickly.
AWS X-Ray: While AWS X-Ray supports multiple programming languages, its coverage is not as extensive as OpenTelemetry's. It primarily caters to the most common languages used within the AWS ecosystem, such as Java, Node.js, Python, and .NET. If your application primarily uses these languages and operates within AWS, X-Ray might be a seamless choice.
2. Integration Flexibility
OpenTelemetry: One of OpenTelemetry's standout features is its integration flexibility. It's designed to be vendor-agnostic, enabling you to integrate with various observability backends, both cloud and on-premises. Whether you're using Prometheus, Jaeger, Zipkin, or any observability vendor, OpenTelemetry provides a standardized way to collect, process and send telemetry data to these systems. This makes it a strong choice if you have a diverse infrastructure and a desire to avoid vendor lock-in.
AWS X-Ray: AWS X-Ray, being an AWS-native solution, offers seamless integration within the AWS ecosystem. It's tightly integrated with other AWS services, making it a natural choice for applications heavily reliant on AWS resources. If you are fully on AWS X-Ray might simplify the process of instrumenting your applications. Moreover, only a handful of third-party observability vendors such as Baselime integrate with X-Ray to enhance to experience of exploring your tracing data.
3. Limitations
OpenTelemetry: OpenTelemetry is open-source and vendor-agnostic. This enables great flexibility but also comes with its own set of challenges. The Total Cost of Ownership of an application instrumented with OpenTelemetry can be significantly higher than an application instrumented with X-Ray where AWS provides support. It’s necessary to be mindful of the resources required to run and maintain the observability infrastructure when choosing OpenTelemetry, as these costs can add up depending on the scale of the deployment.
AWS X-Ray: X-Ray might have better native support on AWS than OpenTelemetry, but in multiple aspects, it’s a less powerful solution. One notable limitation is the maximum trace size, which is capped at 64 kilobytes. This restriction can be problematic when dealing with complex, deeply nested transactions or microservices with extensive interactions, as it may lead to truncated trace data. Additionally, AWS X-Ray doesn’t support high-cardinality and dimensionality data by default. It works like a key-value store and it is therefore not possible to use the tracing data for alerting, or anything other than looking at specific traces or aggregating on a subset of dimensions. Moreover, AWS X-Ray team made the design decision not to automatically instrument internal calls within your application. As such, to get insights into these, you must manually instrument every external call your application makes.
4. Serverless Observability
Observing serverless applications presents unique challenges due to their event-driven nature and ephemeral execution environments.
Serverless with OpenTelemetry
I have a harder time recommending OpenTelemetry to teams fully on AWS and with a predominantly serverless architecture. Serverless architectures tend to communicate using queues, event buses and data streams, on which reliably propagating OpenTelemetry traces is not straightforward. It requires an engineering investment that a lot of teams are not willing to make, especially if they haven’t experienced the benefits of distributed tracing yet. Moreover, instrumenting serverless functions with OpenTelemetry has an impact on cold starts (~300ms with the Baselime Lambda OpenTelemetry SDK) and occasionally invocation latencies too. Every team should assess this additional factor when deciding what to use for distributed tracing on their serverless architecture.
Serverless with AWS X-Ray
AWS X-Ray is a natural fit for AWS serverless environments. It seamlessly integrates with AWS Lambda, API Gateway and other AWS services commonly used in serverless applications. With X-Ray, you can trace requests as they flow through your serverless functions and API endpoints. However, as mentioned above, you will face all the limitations of using AWS X-Ray.
Summary
Now that we've looked at the individual players, let's compare them head-to-head.
| Feature | OpenTelemetry | AWS X-Ray |
|---|---|---|
| Open Source | Yes | No |
| Vendor Agnostic | Yes | No (AWS) |
| Multi-Language Support | Yes | Limited |
| Integration Flexibility | High | AWS Ecosystem |
| Sampling Control | Yes | Yes |
| Total Cost of Ownership | High | Potentially Lower |
| Maximum Trace Size | None | 64 kilobytes |
| High Cardinality | Depends on the Observability Backend | Not Available |
| Inferred Metrics | Depends on the Observability Backend | Not available |
| Automatic Instrumentation | Yes | No |
| Seamless Serverless Integration | No | Yes |
So, back to the initial question, should you use OpenTelemetry or AWS X-Ray? The answer isn't a one-size-fits-all, it really depends on your specific needs.
- Choose OpenTelemetry if you value open-source flexibility, multi-language support, and the ability to avoid vendor lock-in. OpenTelemetry is continuously evolving to cover more and more observability use cases. It’s an excellent choice if your architecture spans multiple resource types, but it can be difficult to implement for serverless architectures.
- Opt for AWS X-Ray if you're deep in the AWS ecosystem, need tight integration with other AWS services, and appreciate the ease of use that comes with a managed service. That said, be ready to use a third-party vendor if you need to go beyond simply visualising individual traces with your data.
I hope AWS will enable X-Ray to export OpenTelemetry-compliant tracing data to third-party backends in the coming months.