We’re launching the Baselime Vercel Integration! It connects to your Vercel account and provides you with next-generation logging and observability for your Vercel applications.
The Baselime Vercel Integration gives you visibility inside your Vercel applications without code changes. Right out of the box, Baselime covers:
- Full-text search and regular expressions across your edge, function and build logs
- Real-time error tracking
- Alerting based on derived metrics from your logs
- Pre-defined and custom dashboards to visualise your data and traffic
- Logs Live Tail, both in the Baselime console and using the Baselime CLI
- Service Discovery to accelerate troubleshooting
- Fast complex queries across your logs
We built this integration to enable any developer on Vercel to detect and resolve errors and performance bottlenecks in their applications before anyone notices.
Request and Build Logs
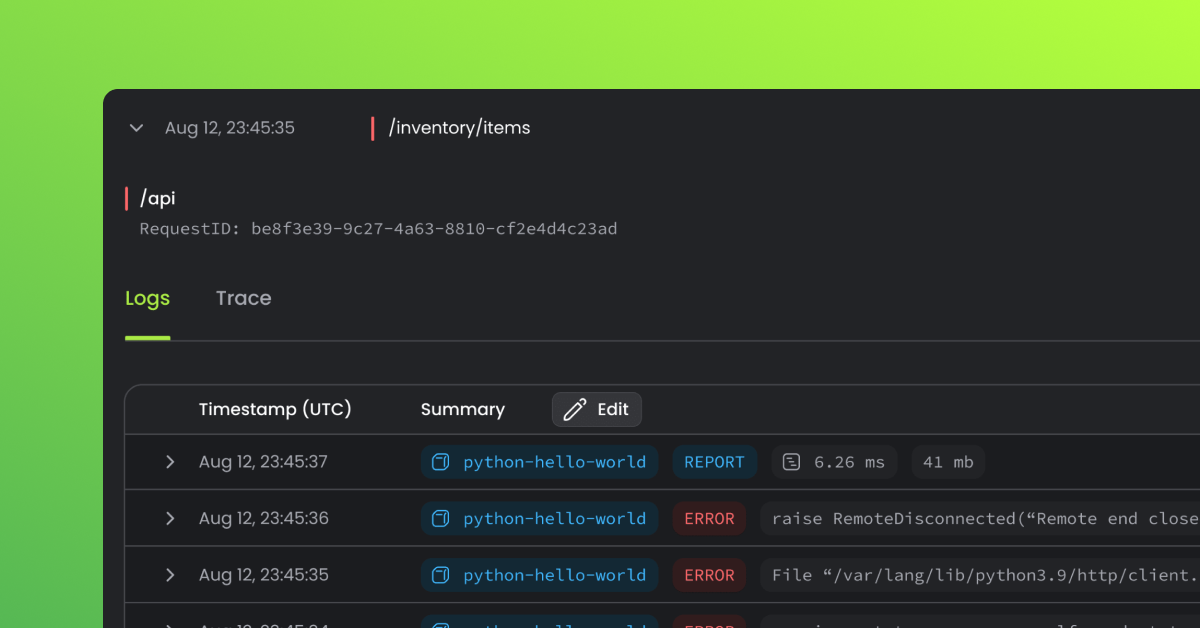
Once you install the Baselime Vercel Integration, logs from your Vercel account stream into Baselime, and you can search, query and analyse your logs across any dimension.
Baselime automatically groups your logs per request and captures performance metrics such as duration, cold start or memory used. You can view the logs for a single request in isolation to investigate a specific issue, or query across multiple requests or routes to identify trends.

Automatic Error Tracking
Baselime automatically tracks errors from your applications, at no additional cost. When a new error is detected in your stack for the first time, we send you a notification (Slack or email) and we keep track of the error for every subsequent occurrence.

Dashboards
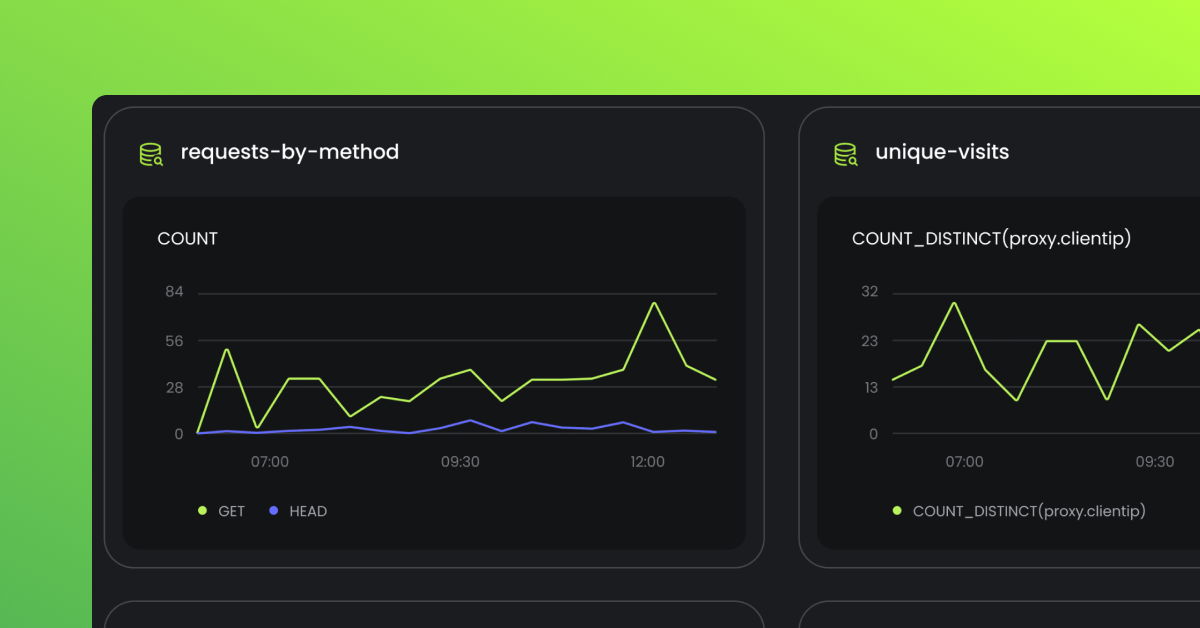
We built our Vercel template dashboard to showcase key performance metrics across your Vercel account. This dashboard enables you to quickly track error rate per route, slow routes, popular pages or unique visits per page.
This dashboard is only a starting point; from here you can dig deeper into the data with the Baselime “Investigate” capabilities. “Investigate” enables you to go right from noticing signs that something is not quite right, to querying your logs to understand exactly why.

Real User Monitoring
In addition to back-end capabilities, Baselime enables you to track page views and web vitals from your React and Next.js applications using the @baselime/react-rum npm package.
function Page({ child }) {

return (
    <BaselimeRum apiKey={apiKey} service="my-app" enableWebVitals>
        {child}
    </BaselimeRum>)
}
With this package, Baselime tracks every page view of your application with metadata such as language, userAgent, country or device.
Additionally, you can enable capturing web vitals from your applications, and the following properties will be captured.
- Time To First Byte (TTFB)
- Largest Contentful Paint (LCP)
- First Input Delay (FID)
- Cumulative Layout Shift (CLS)
Once the data is ingested into Baselime, you can query, search and analyse the performance and user experience of your applications in the Baselime console. You can create dashboards and alerts based on Real User Monitoring metrics.
What’s next?
This is just the beginning of our support for Vercel applications. Over the next few weeks we aim to release:
- Support for OpenTelemetry tracing on Vercel
- Automatic Error Tracking for front-end applications
- An AI co-pilot for analysing your Vercel logs
- Real User Monitoring for other front-end frameworks
Try the Baselime Vercel Integration today for free, and I also invite you to join our Slack community to help shape the future of observability for Vercel.

