
TL;DR
- A brand new query and alert visual builder ✨
- A connector to add CloudWatch metrics to your observability toolkit
- Continuous Observability with all major CI/CD providers
- Improved Observability Reference Language (ORL) with templates and variables
- Simplified CLI commands
- OAuth authentication
- And much more…
Be the first one to know about all these updates, join the devs in our Slack community.
💯 What’s New?
Buckle up, we’re kicking off the year with a long one. We've shipped a lot over the past few weeks (mostly on Fridays) as we're gearing up for our public release.
A Brand New Visual Builder ✨
They say a picture is worth a thousand words, and a video is worth a thousand pictures. That’s a lot of words to say observability for serverless has never been this easy. Sit back, watch the video and let us know your thoughts!
The visual builder facilitates drafting queries and alerts in the web console. When you're troubleshooting live issues in production, this is a lifesaver. For the more seasoned OaC enthusiasts, you can always revert back to the code editor to write your queries and alerts as code.
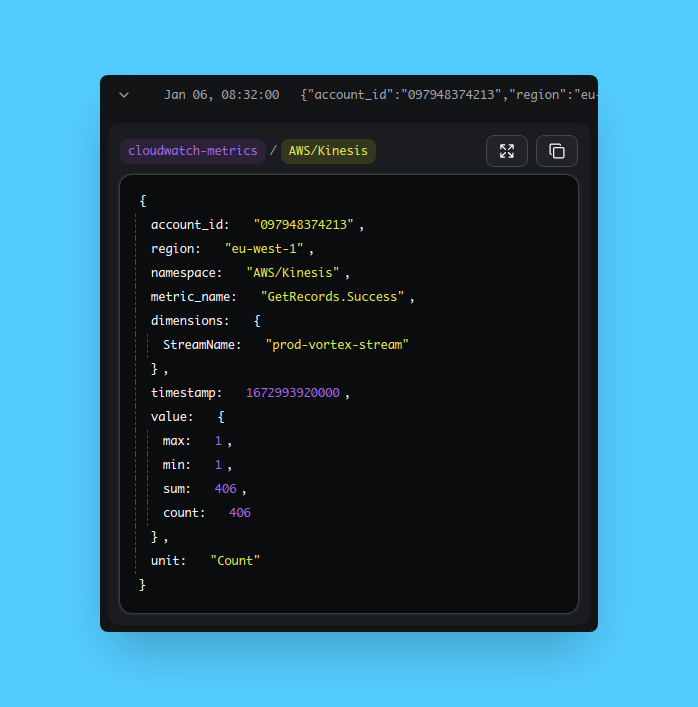
CloudWatch Metrics Connector
After AWS Lambda logs, CloudTrail logs and API Gateway logs, we're excited to introduce the connector for CloudWatch metrics.
And there's nothing more for you to do. When you connect your AWS Account to Baselime, we deploy all the necessary infrastructure to capture all your CloudWatch metrics and send them to our backend. Once data is ingested, you can run arbitrary queries on any nested field of your metrics (all nested fields are indexed in Baselime).
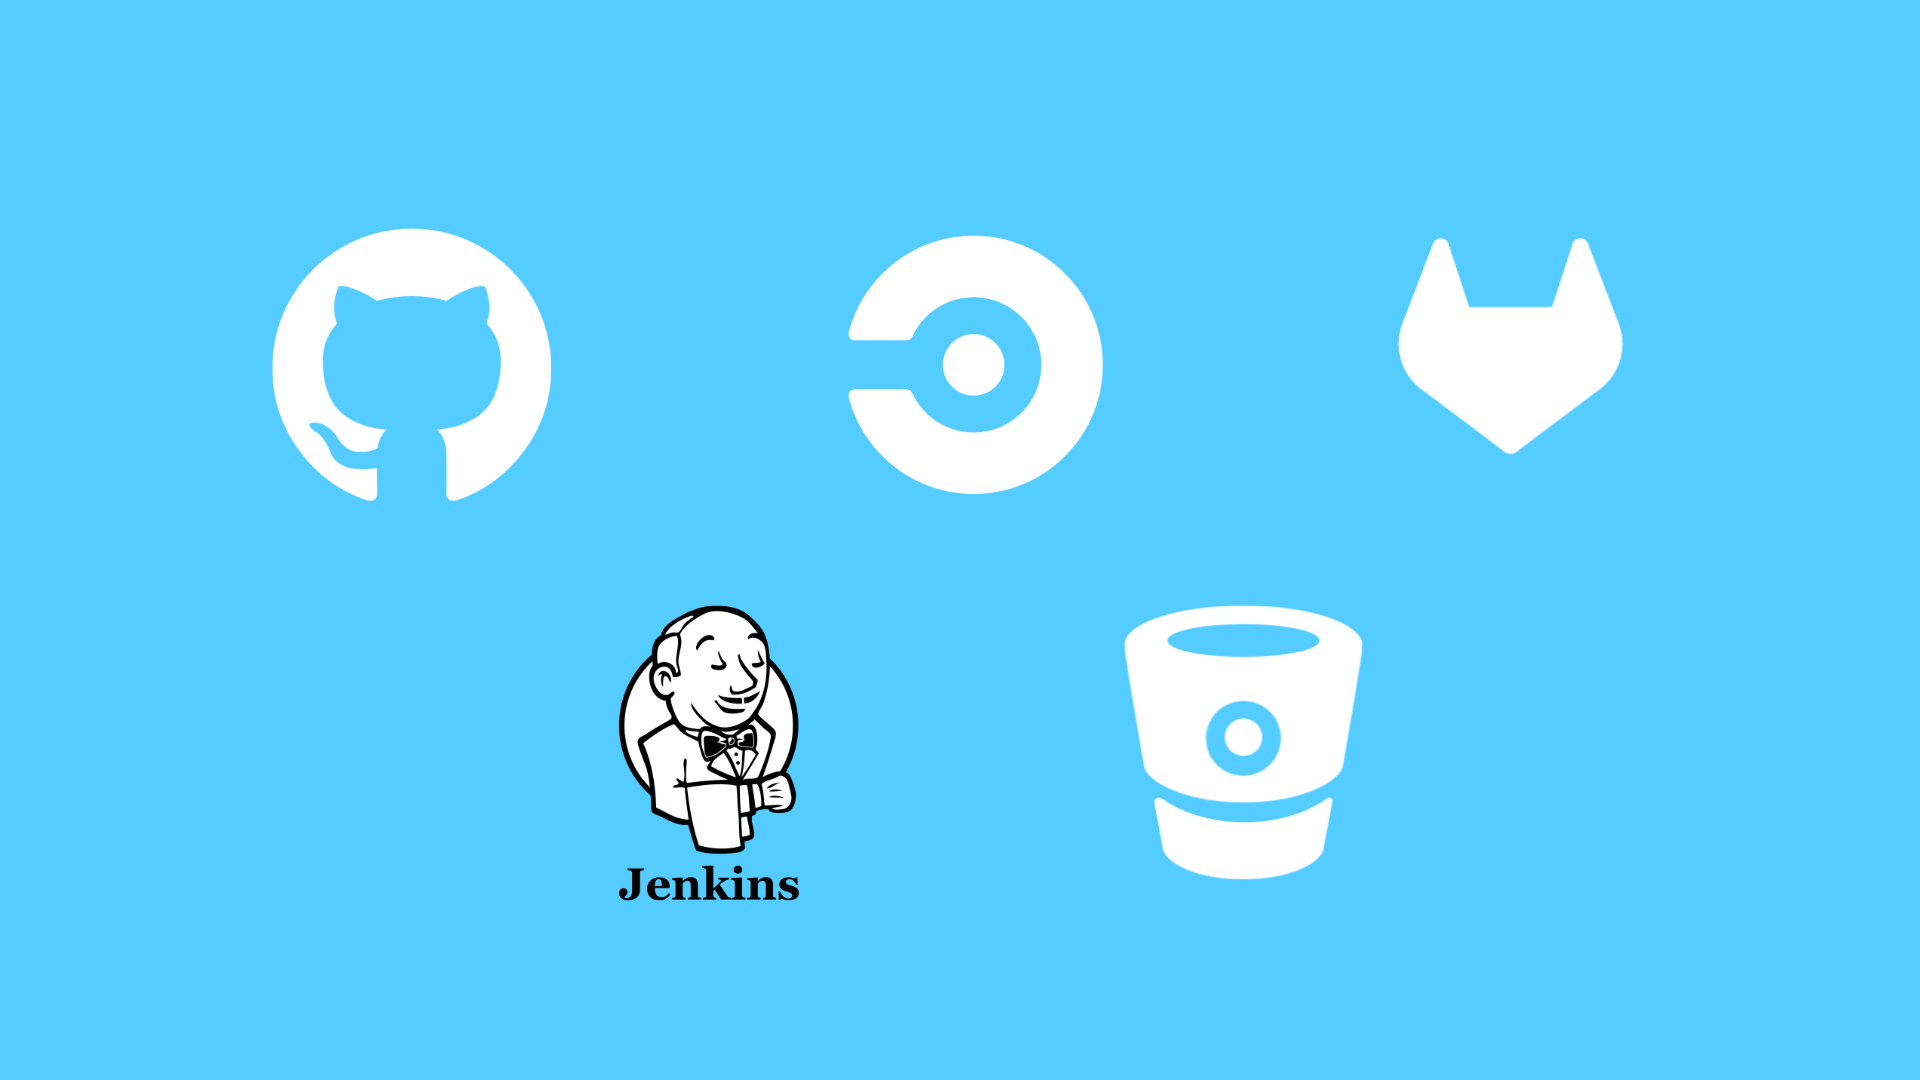
Continuous Observability with all the major CI/CD providers
Observability as Code (OaC) is great but what's better is automating it as part of your CI/CD pipelines. We've built integrations with all the major CI/CD providers such that you can use the Baselime CLI from anywhere. Running your own DIY CI/CD platform? Don’t worry, we also provide you a Docker image with the Baselime CLI - simply download our Docker image and you're good to go.
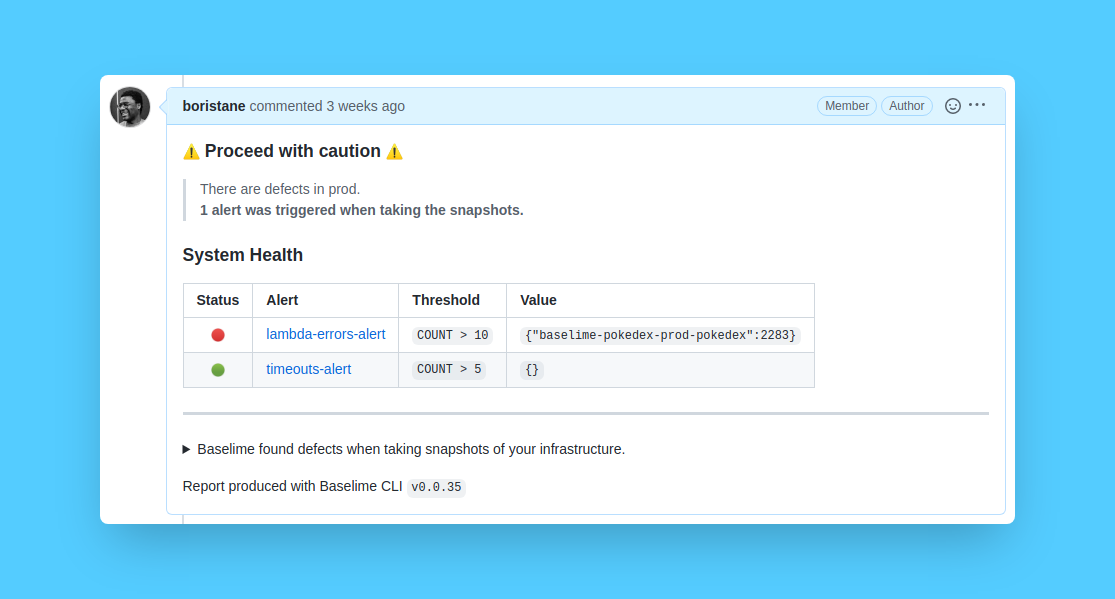
In addition, we have greatly improved our baselime report command. It enables you to send reports on the health of your services to your destinations of choice. Currently, the best supported platform is GitHub, we're working on sending to Slack, webhooks and others. Hit us up anywhere to suggest additional platforms.
Observability Reference Language (ORL)
Over the past few months, we've greatly simplified the syntax to declare your Observability as Code. The time has come to name it. 😀 We’re delighted to introduce the Observability Reference Language (ORL). Don't hesitate to visit our docs to learn more.
The latest improvements to the ORL are templates and variables.
Templates
Using the baselime templates command, your entire team can create OaC templates which can be used by anyone in your workspace. Don’t forget you can also use any of the public community templates. Once a template is created, you can reference it in the Observability Reference Language of any service. This service will automatically be monitored as defined in the template along with all its queries and alerts.
Variables
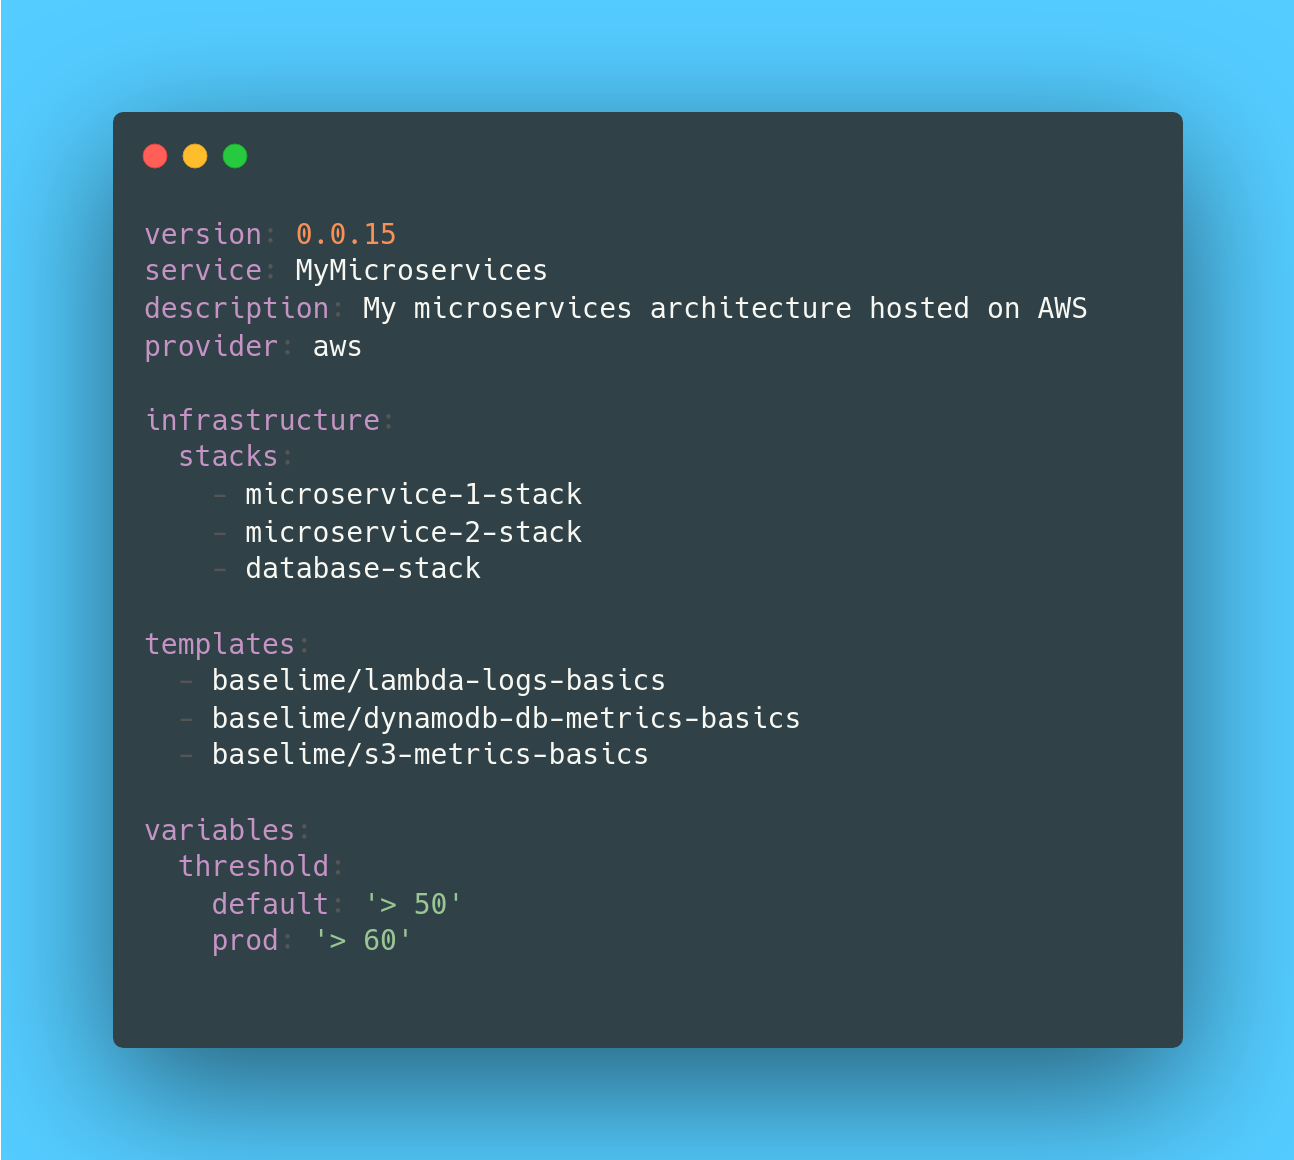
Typically, you want different observability configurations for different environments or even different services. For example, you might want the alerts to be checked more frequently in production and with more stringent thresholds than in dev or staging environments.
We got you covered. With ORL variables, you can define the same query or alert and use different values depending on the environment. Check out the full docs for further details.
Simplified CLI commands
The overall feedback we got from the Baselime CLI was that it was geared towards advanced users.
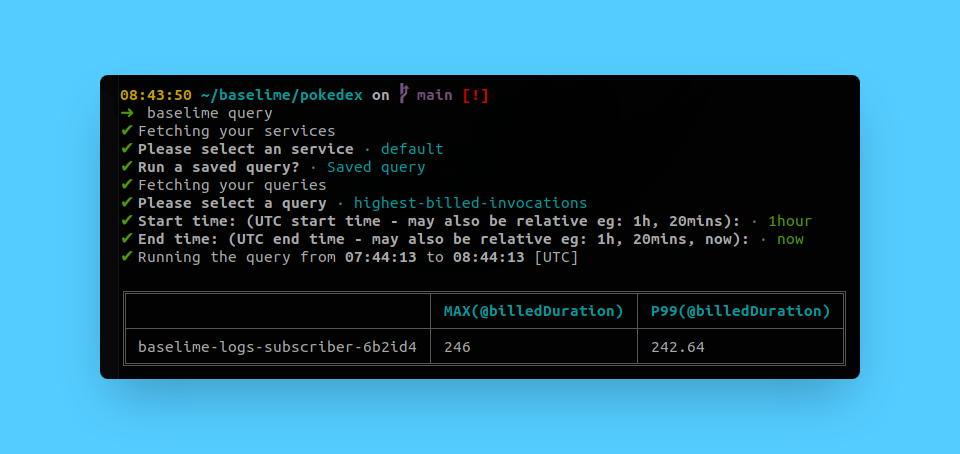
We went back to the drawing board. Now most common commands are interactive and come with guides on next steps once command are completed.
Moreover, we drastically improved the docs. Please check it out and let us know your thoughts.
OAuth Authentication
It's great to have OAuth in the web console. What's even better is an OAuth flow in the CLI. Long gone are the days of needing a one-time-password to log-in the Baselime CLI. Everything is way more seamless now.
🎯 What’s Next?
- OpenTelemetry Connector: I know many of you reading this are waiting for it. Next time we email you, we’ll have OTel support in Baselime
- AWS X-Ray Connector: So you have X-Ray enabled, but don't leverage this telemetry data because it's stuck in the AWS Console and the UX is infuriating? By this time next month, you'll be able to send all your X-Ray traces to Baselime and benefit from Continuous Observability
- Dashboards: A dashboard is a place to pin multiple queries you want to look at often and/or share with your team. We're working on bringing you templated dashboards, and the ability to create your own (both visually and As Code)
👨💻 Hiring
We're looking for an exceptional front-end developer to help us build the future of observability:
If this is you, the best time to join us was yesterday. The next best time is today!
We’re looking forward to welcoming you in our Slack community. Let’s make Observability as Code the new norm!