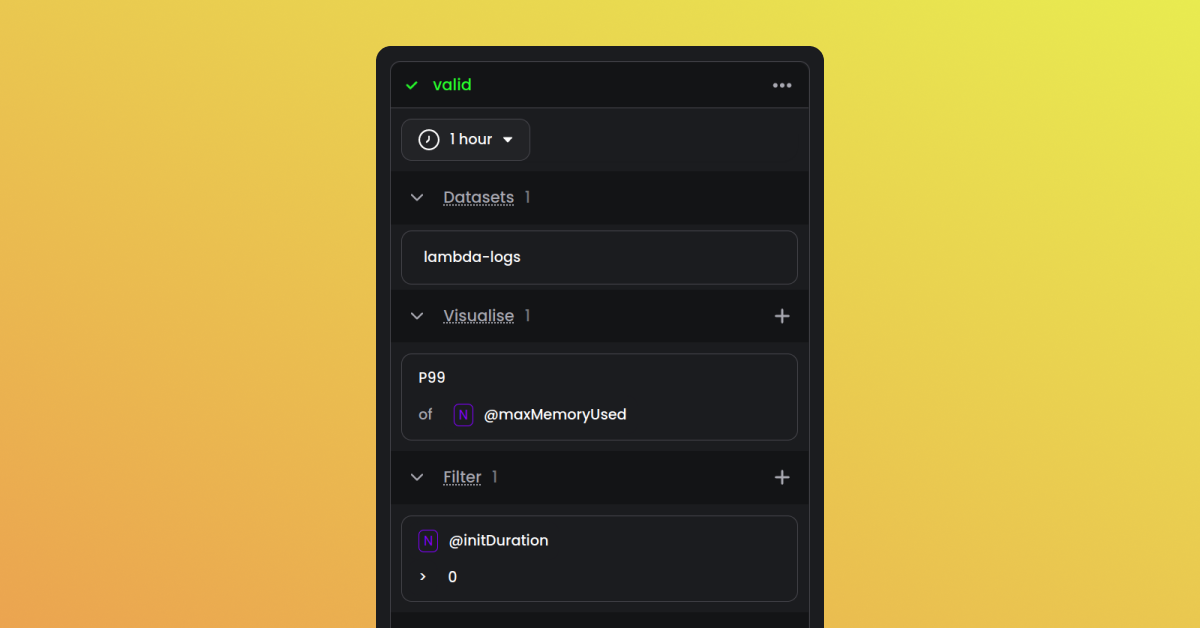
New Query Builder
We made it easier to build queries in the web console with our new query builder. You’ll find it on the left side of the screen and it’ll help you create queries much faster. This new layout enables you to get the data you need quickly so you can focus on what matters most.
New Alerts Builder
We also made it easier for you to build alerts in the web console with our new alerts builder. It’s now less verbose, which means you can create alerts more faster, with fewer clicks. This new layout enables you to set up alerts that will notify you of issues before they become critical.
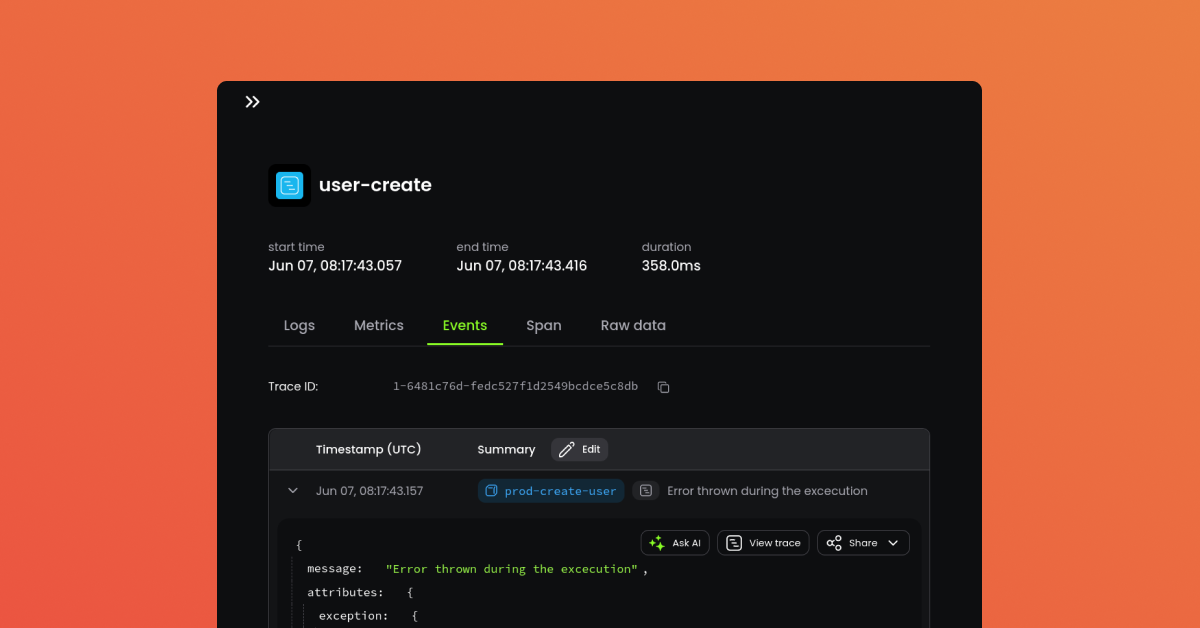
Support for OpenTelemetry Events
You can now add events to your OpenTelemetry spans and see them in a new tab in the span view. This enables having greater context around your spans, so you can better understand what’s happening in your system.
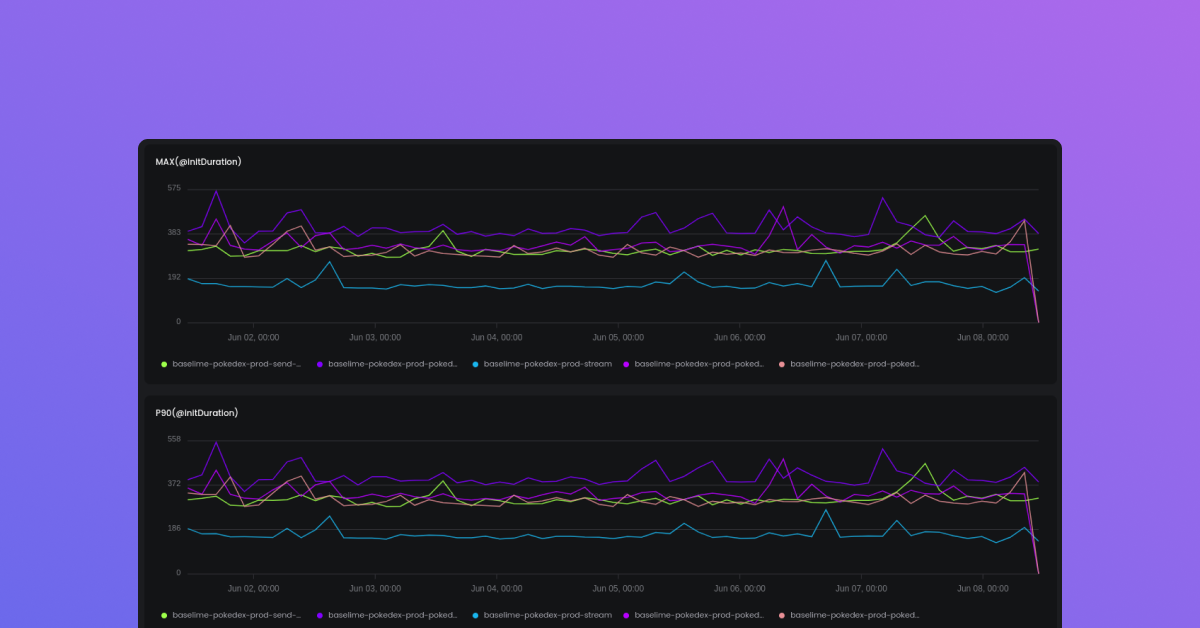
Cleaner Charts
We cleaned up our charts, they’re more readable and have a better choice of colors. The new charts enable you to quickly spot trends and anomalies, so you can take action before they become problems.
Improvements & Fixes
- Fixed the granularity selector in the console when a custom timeframe is selected
- Prevented adding the same chart to a dashboard multiple times
- Fixed redirect when clicking on the Upgrade button
- Fixed the log level in the Node Lambda Logger - now the log level is mapped to the level used in the logger
- Improved ingestion reliability with improved autoscaling
- Improved aggregate results table to improve readability