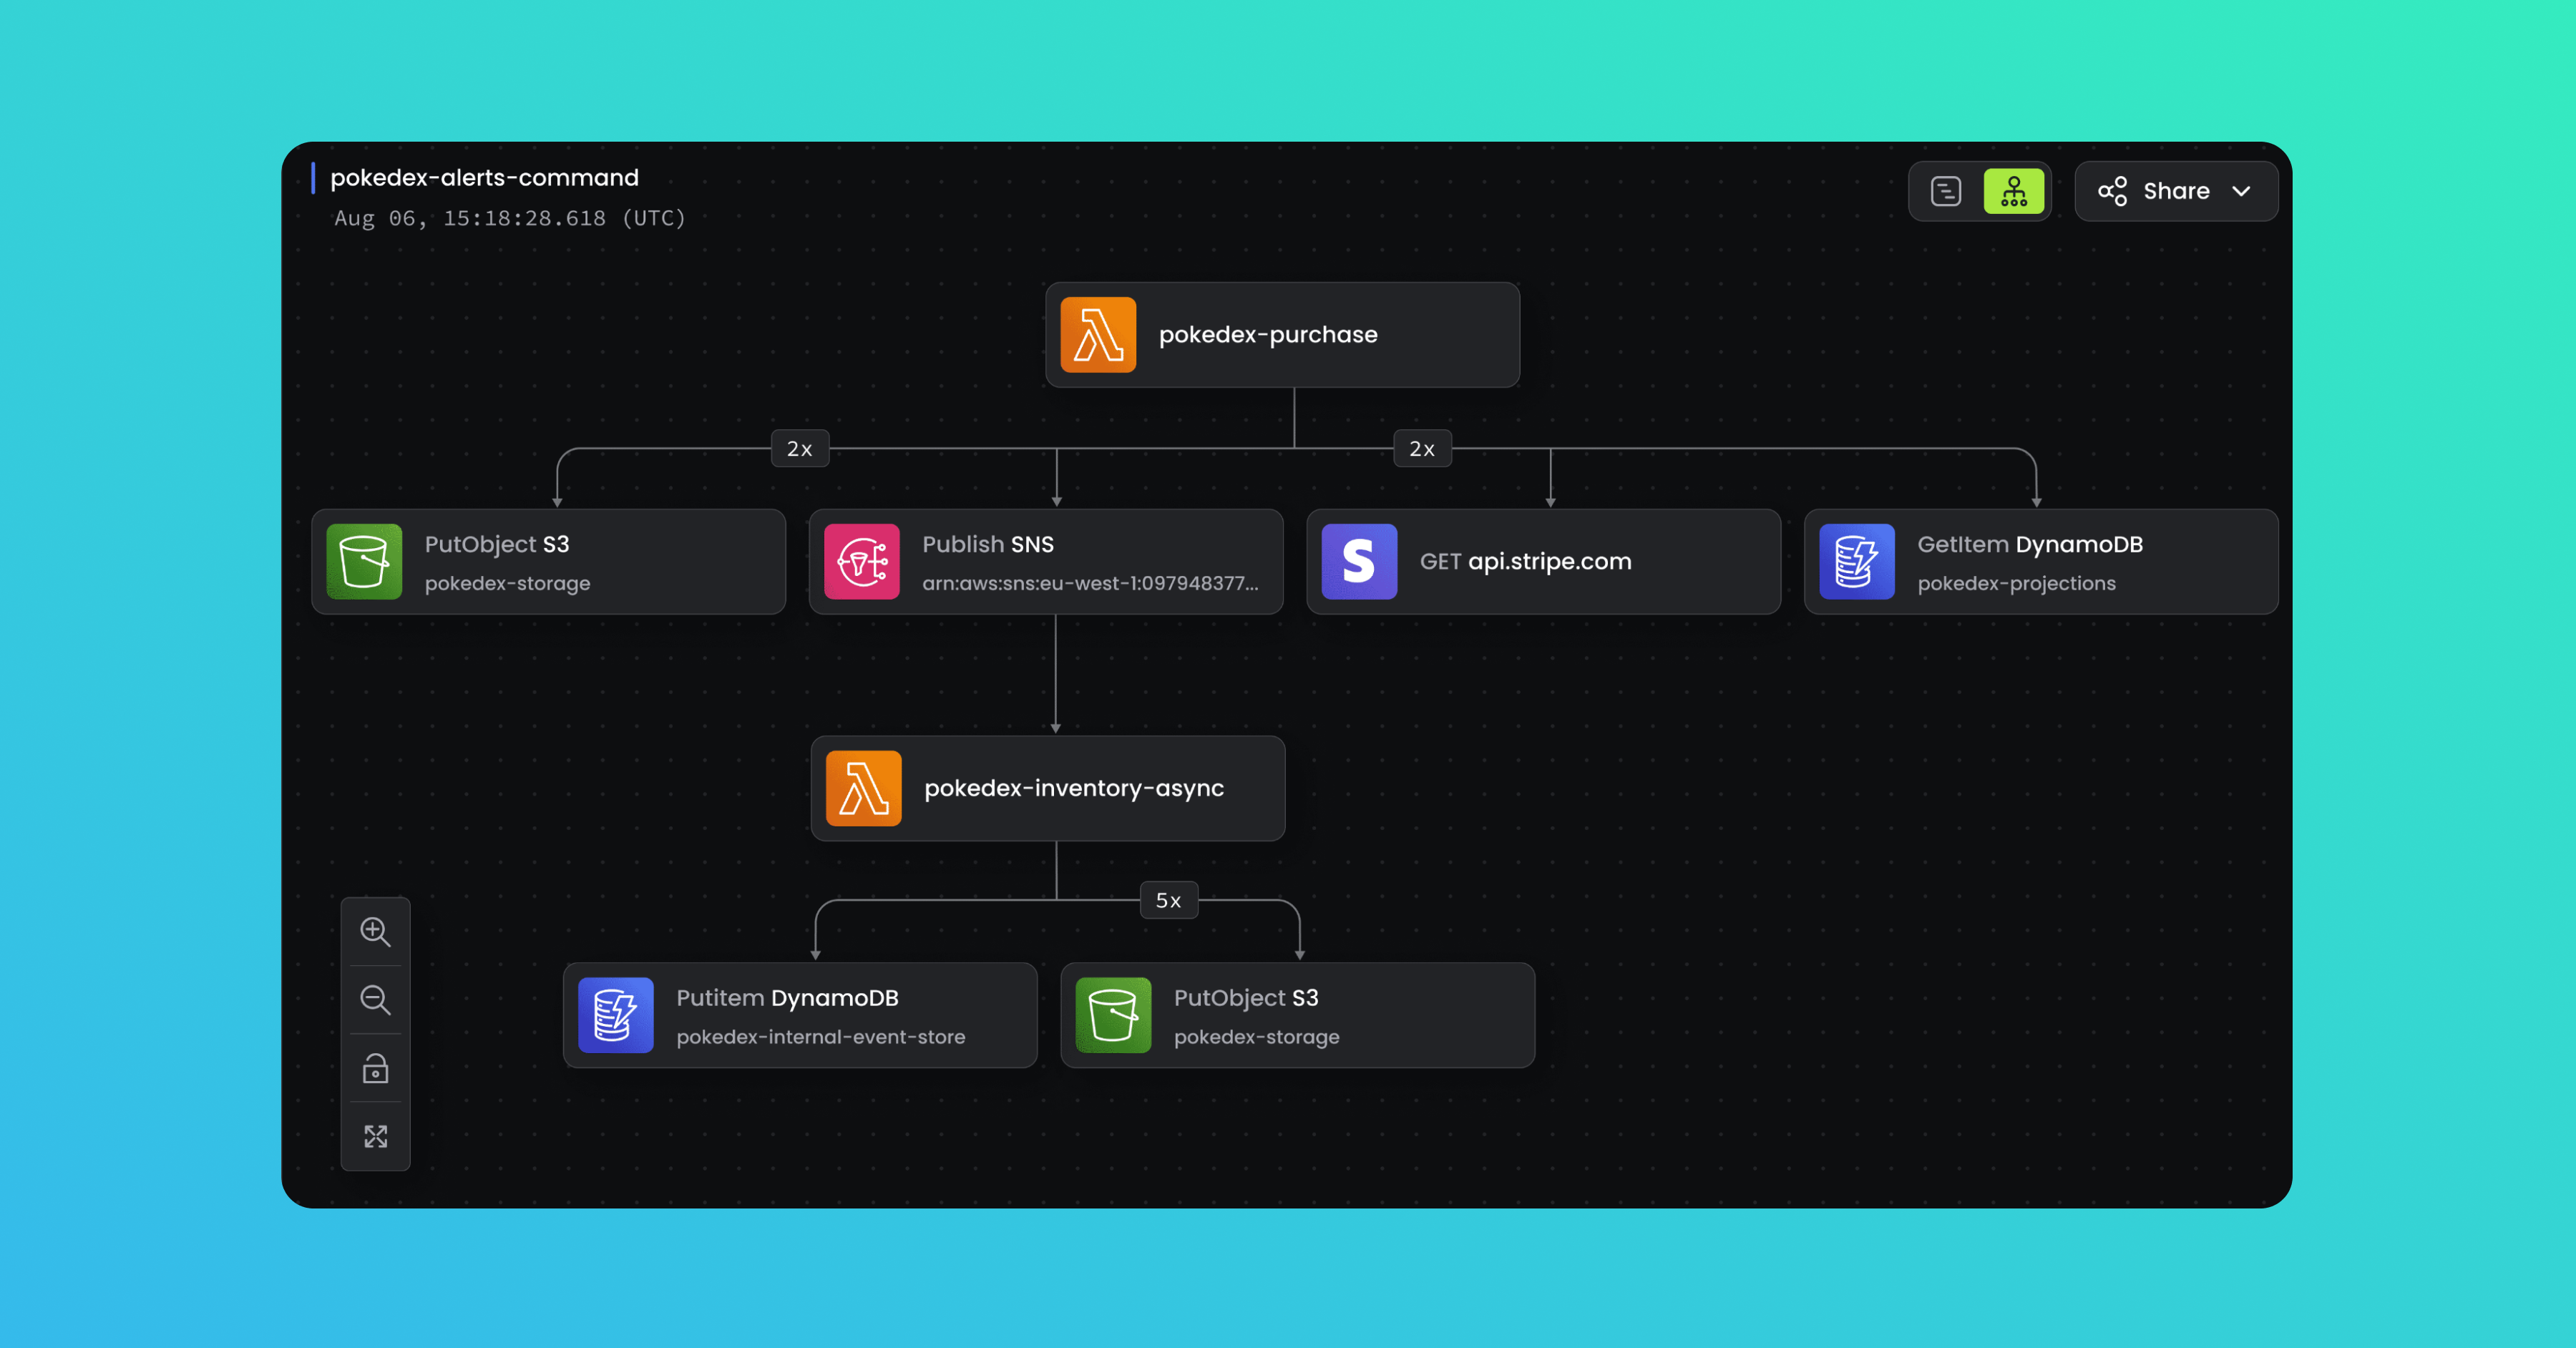
Trace Diagrams
We are super excited to introduce trace diagrams in Baselime! Now you can view all the traces in the console as trace diagrams alongside trace timelines. This new view enables you to quickly understand the architecture of your services and easily pinpoint hot spots in the traces. Take a visual approach to observability and gain valuable insights effortlessly.
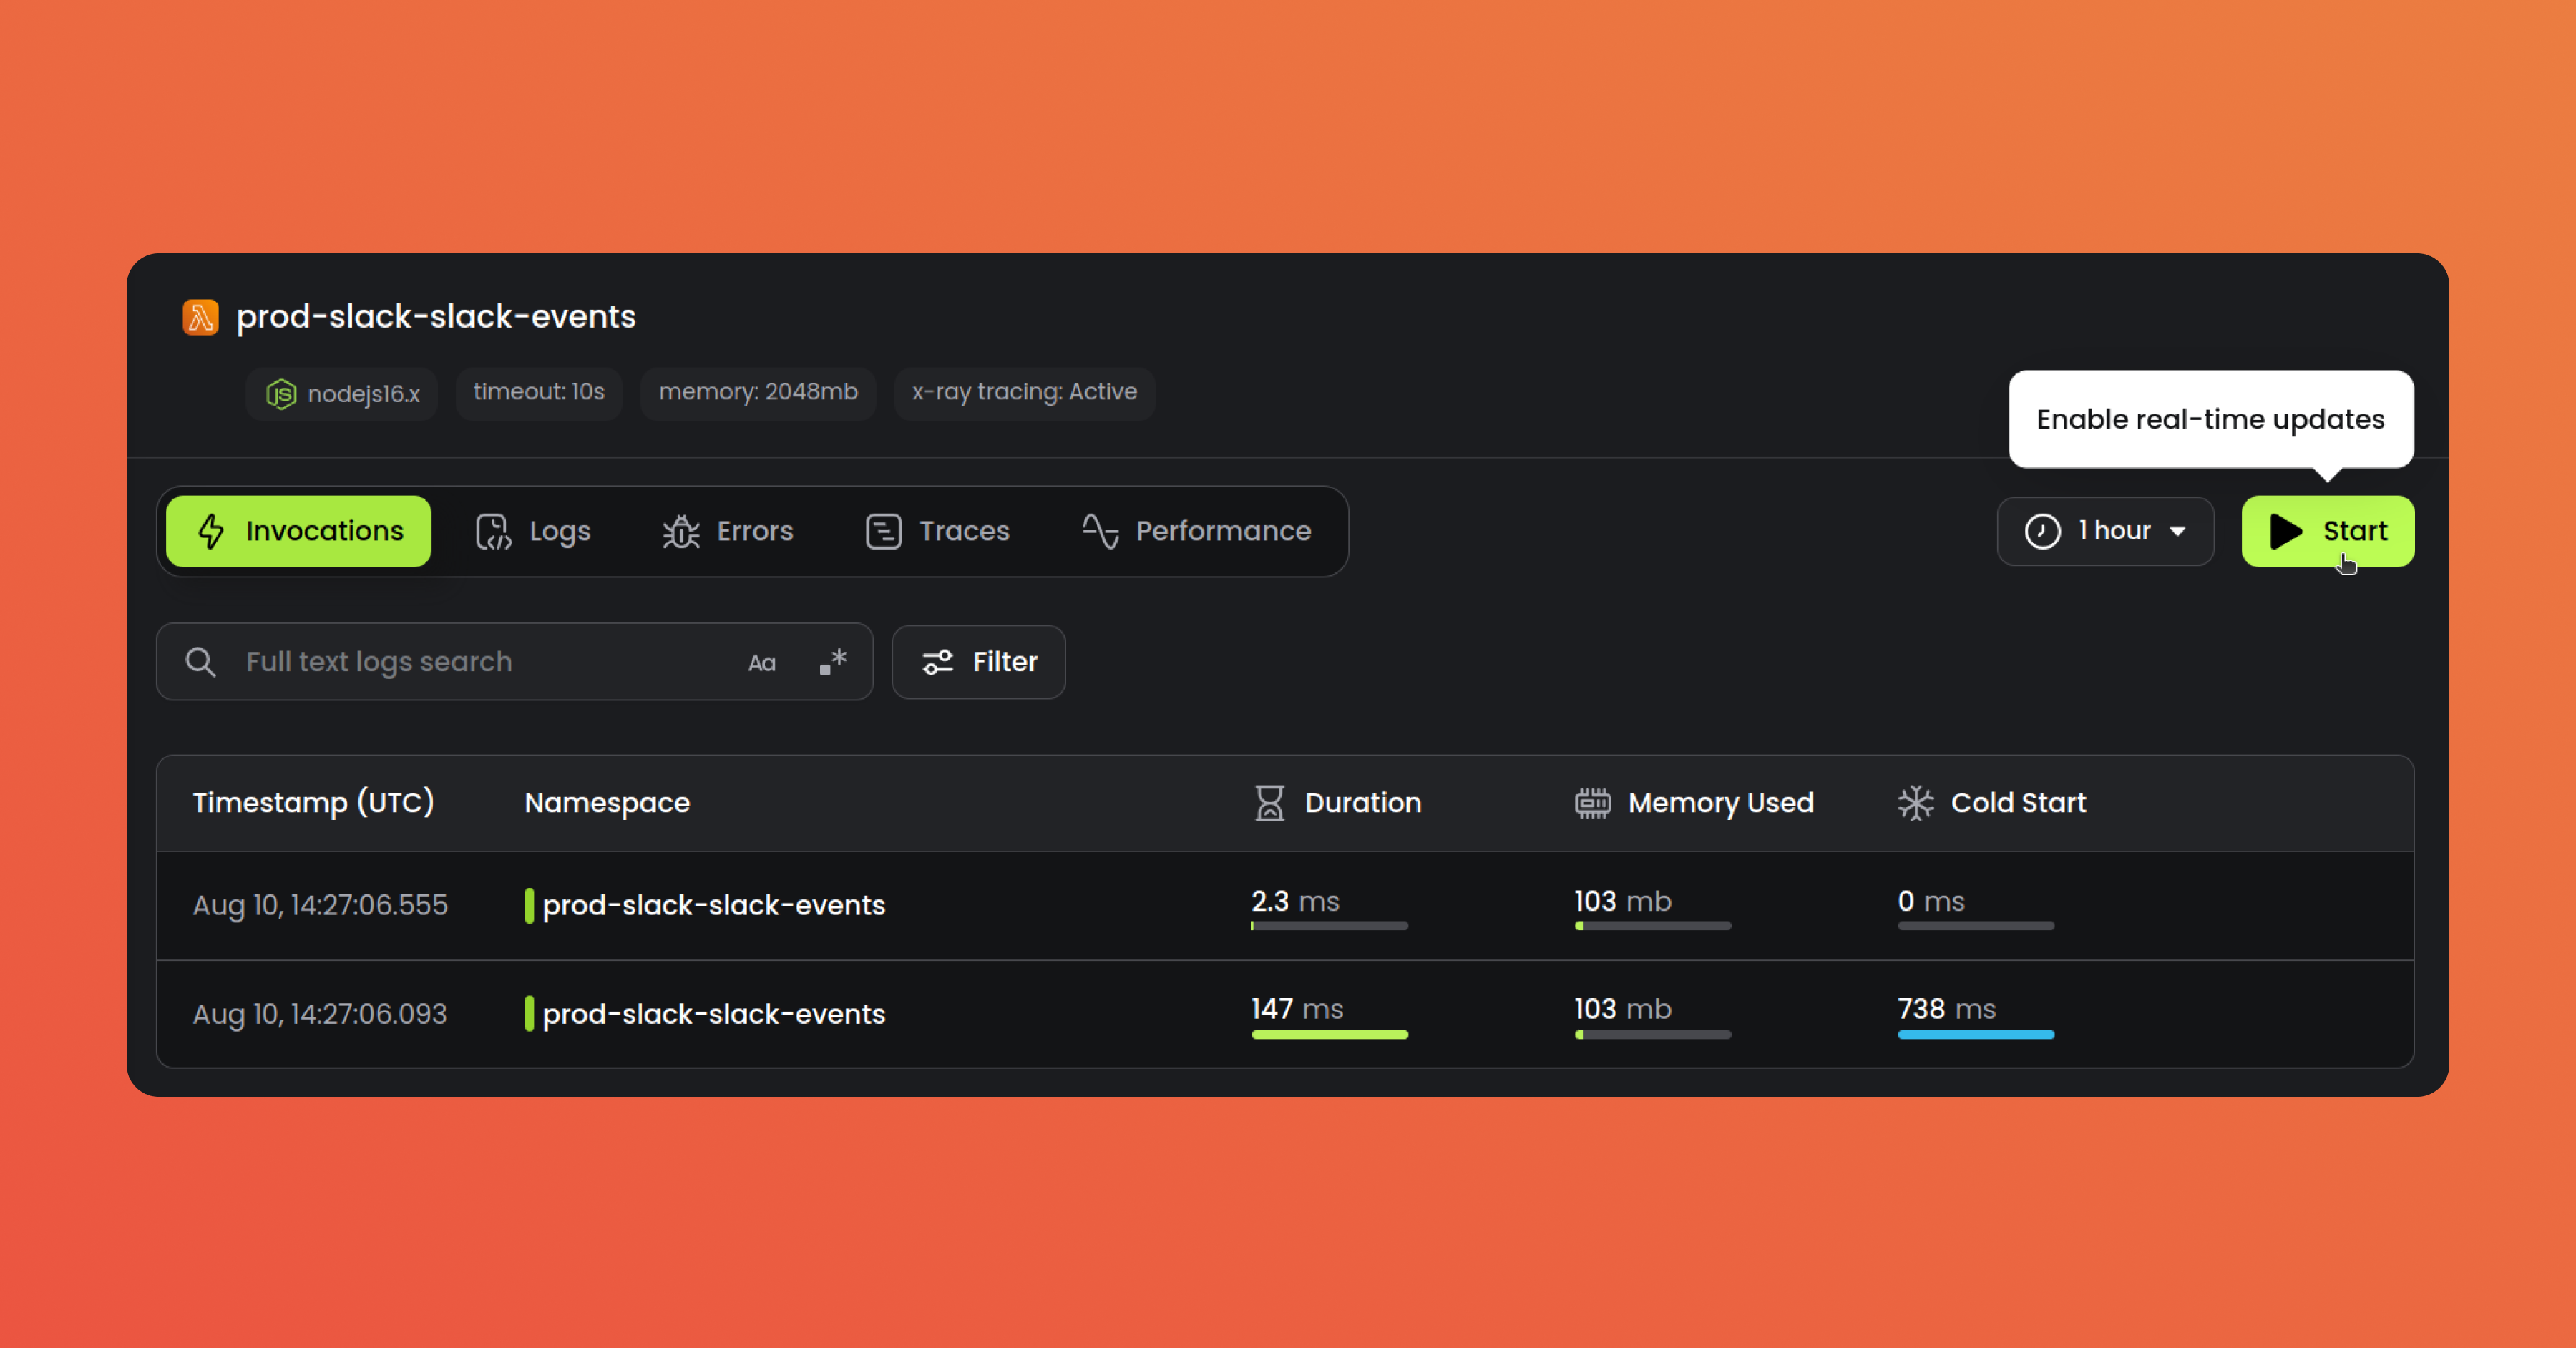
Live Tail for Logs and Invocations
We understand the importance of real-time monitoring, and that’s why we’re excited to announce the live tail feature for logs and invocations in the console. When viewing an AWS Lambda function, you can now live tail the logs and invocations of the function. This enables you to visualise the latest events in real-time and take immediate action when needed.
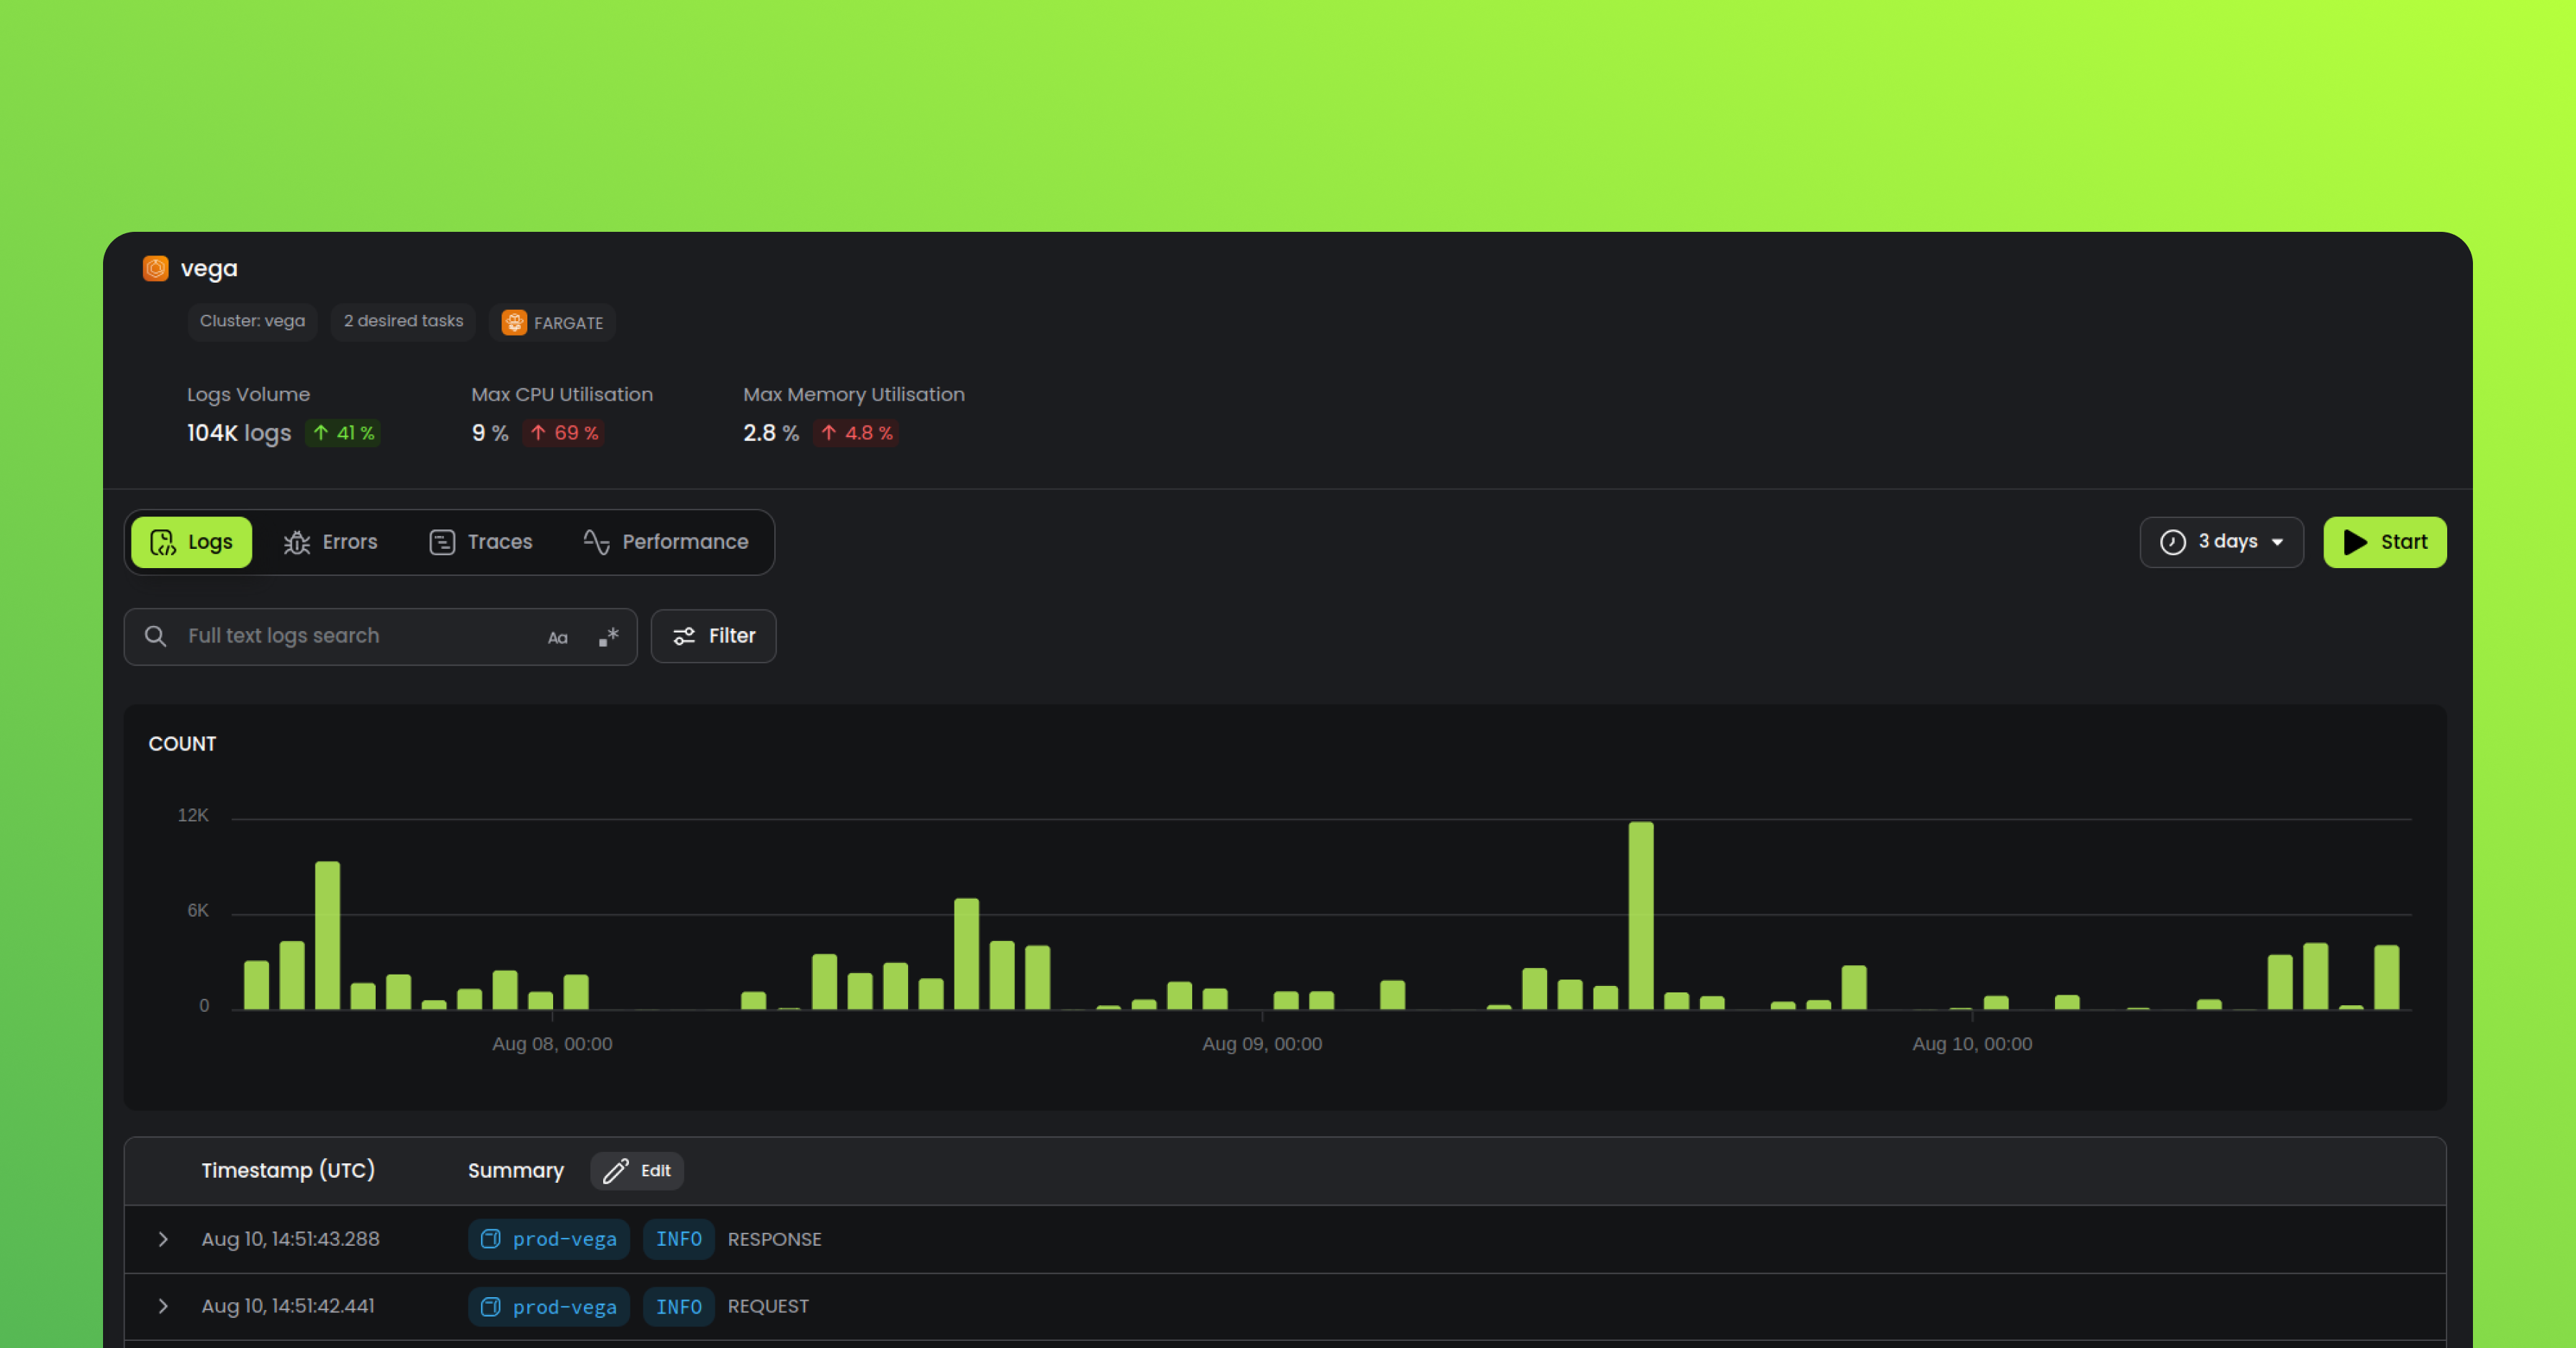
ECS Services (Fargate + EC2)
We’re pleased to introduce native support for Amazon ECS services, including Fargate and EC2, in the Baselime console. It allows you to view and query all logs and traces, as well as access metrics from your ECS services. ECS stops being a blind spot in your microservices stack.
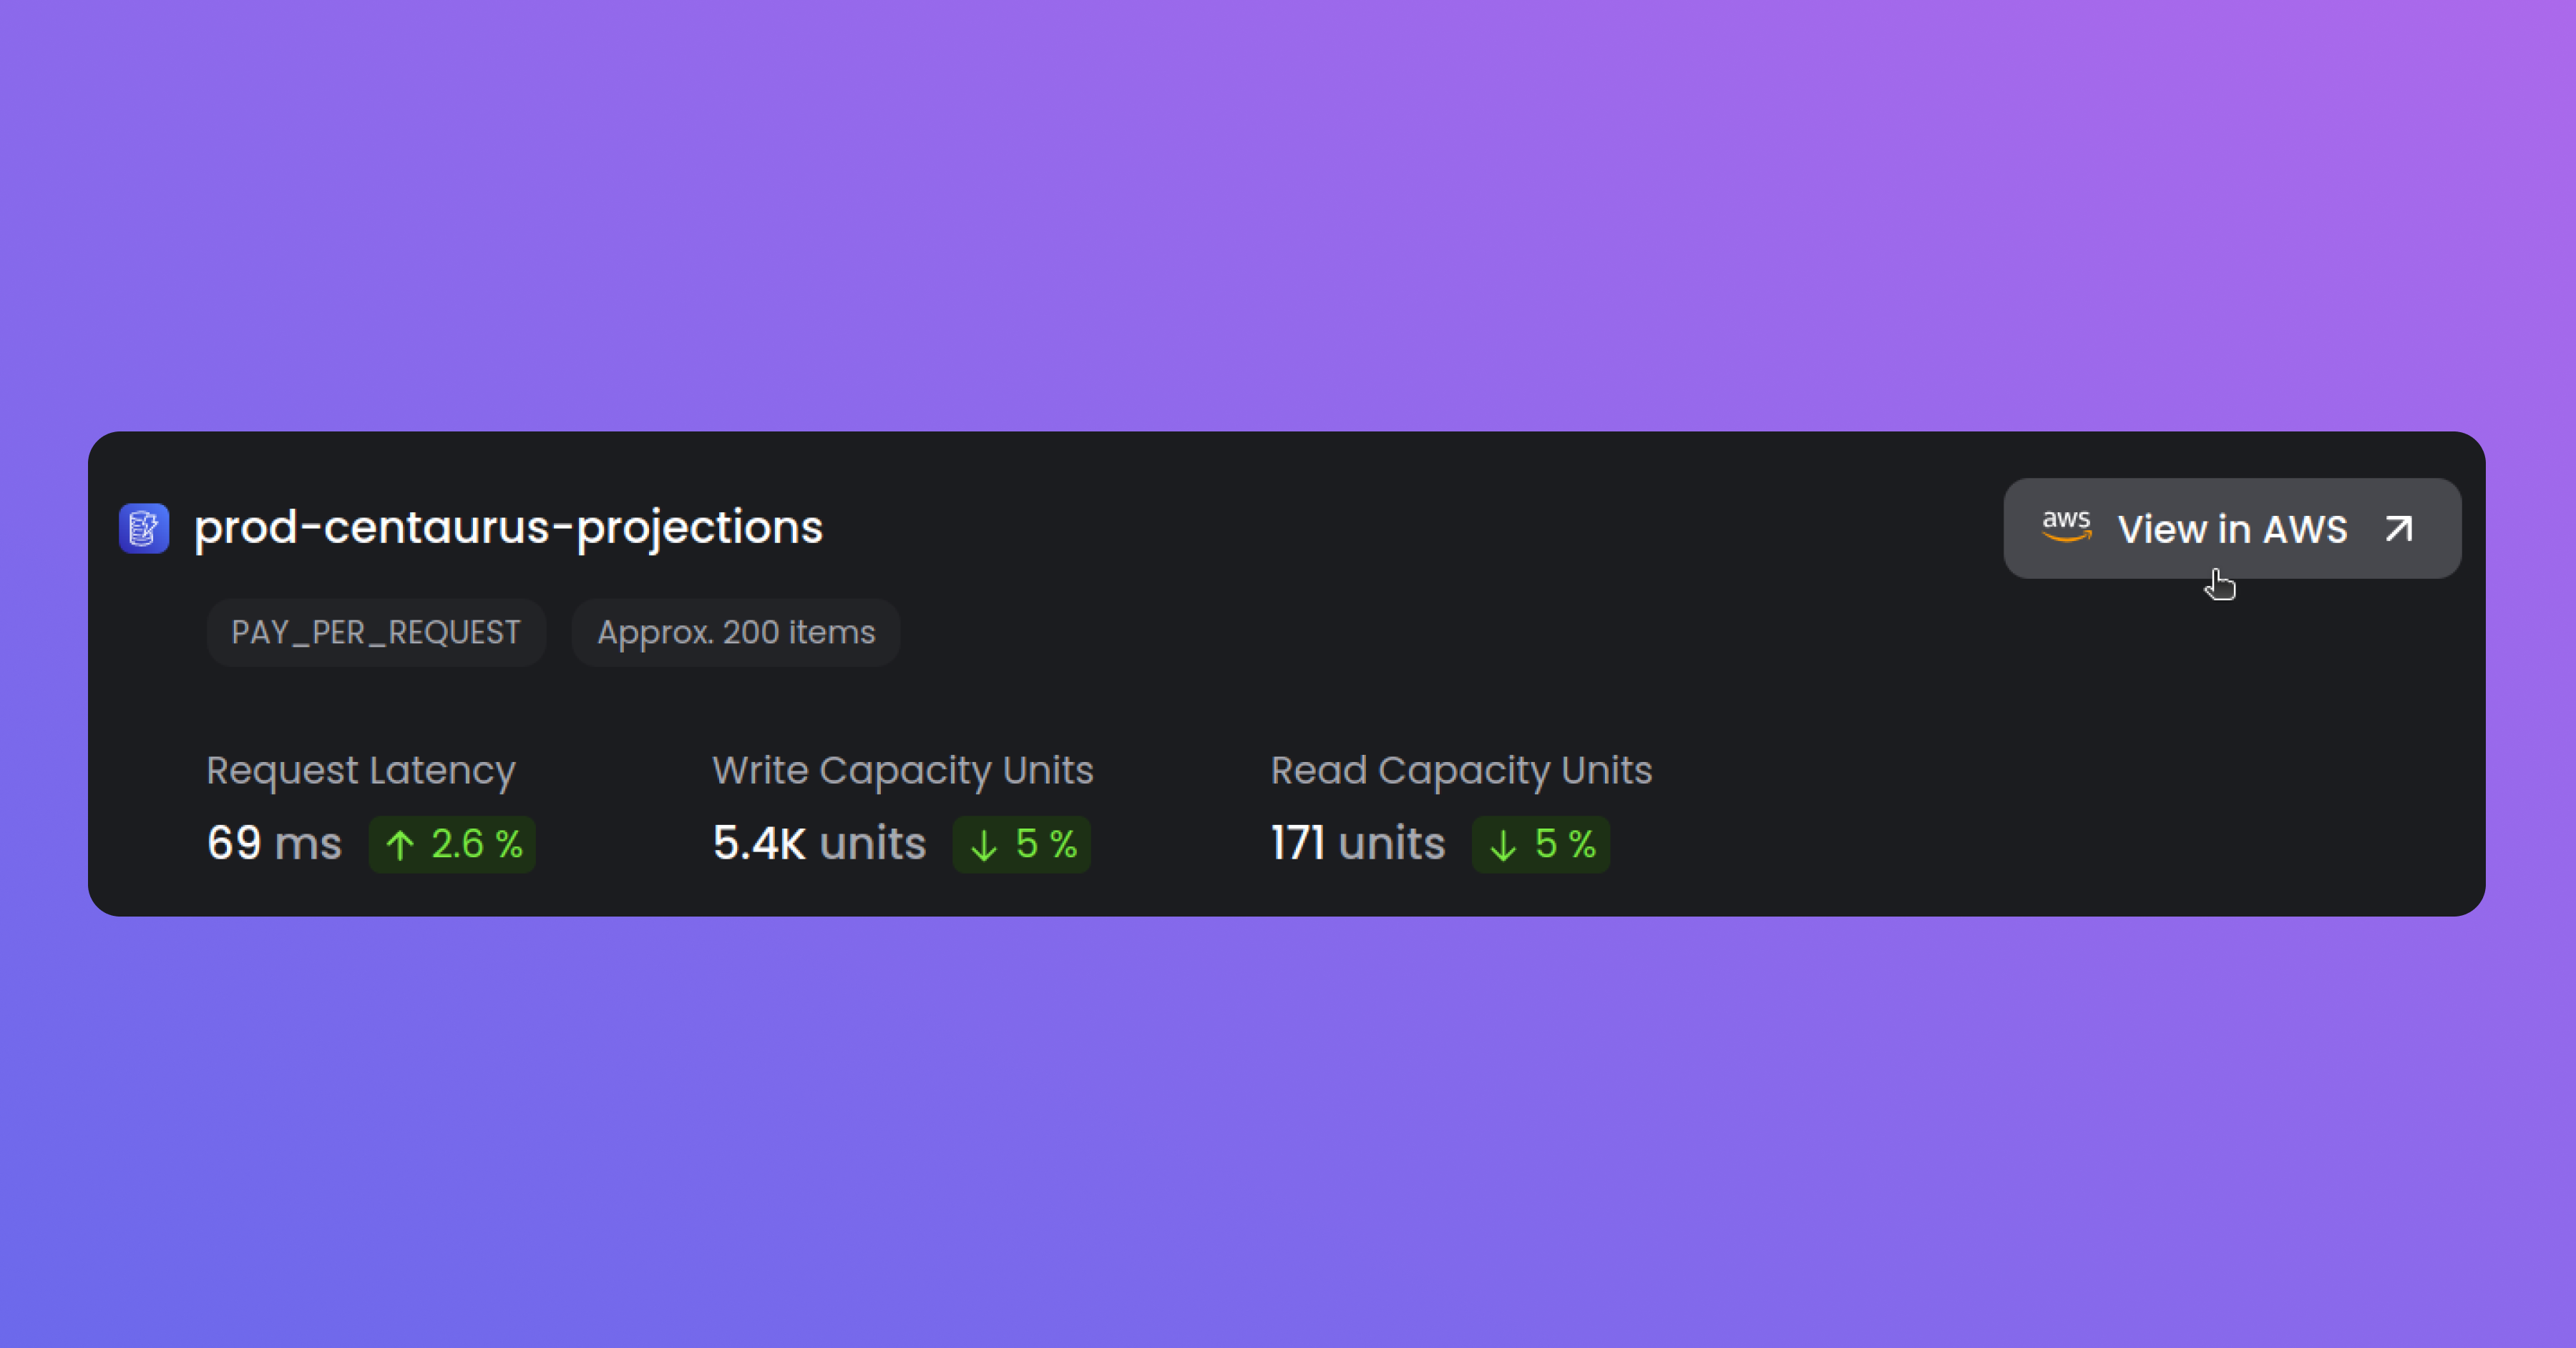
DynamoDB Tables
In our continuous effort to expand our native support, Baselime now offers native support for DynamoDB Tables. Effortlessly view and query all the traces of processes that accessed your DynamoDB Tables and slice & dice your DynamoDB Table metrics. Dive deep into your DynamoDB performance and uncover valuable insights to optimize your database operations.
View in the AWS Console
We made it even easier for you to investigate and resolve issues by introducing the “View in AWS” button. Every resource in the Baselime console has a direct link to the corresponding AWS console page. Spotted something odd on a resource? Click the button and quickly navigate to the AWS Console for more. Seamlessly bridge the gap between Observability and Infrastructure for a smoother troubleshooting experience.
Improvements & Fixes
- Added tooltips throughout the console to improve navigation
- Improved the performance of Service Discovery
- Enabled Service Discovery for SQS Queues, DynamoDB Tables, Kinesis Data Streams and ECS services
- Improved the onboarding flow with personalisation options
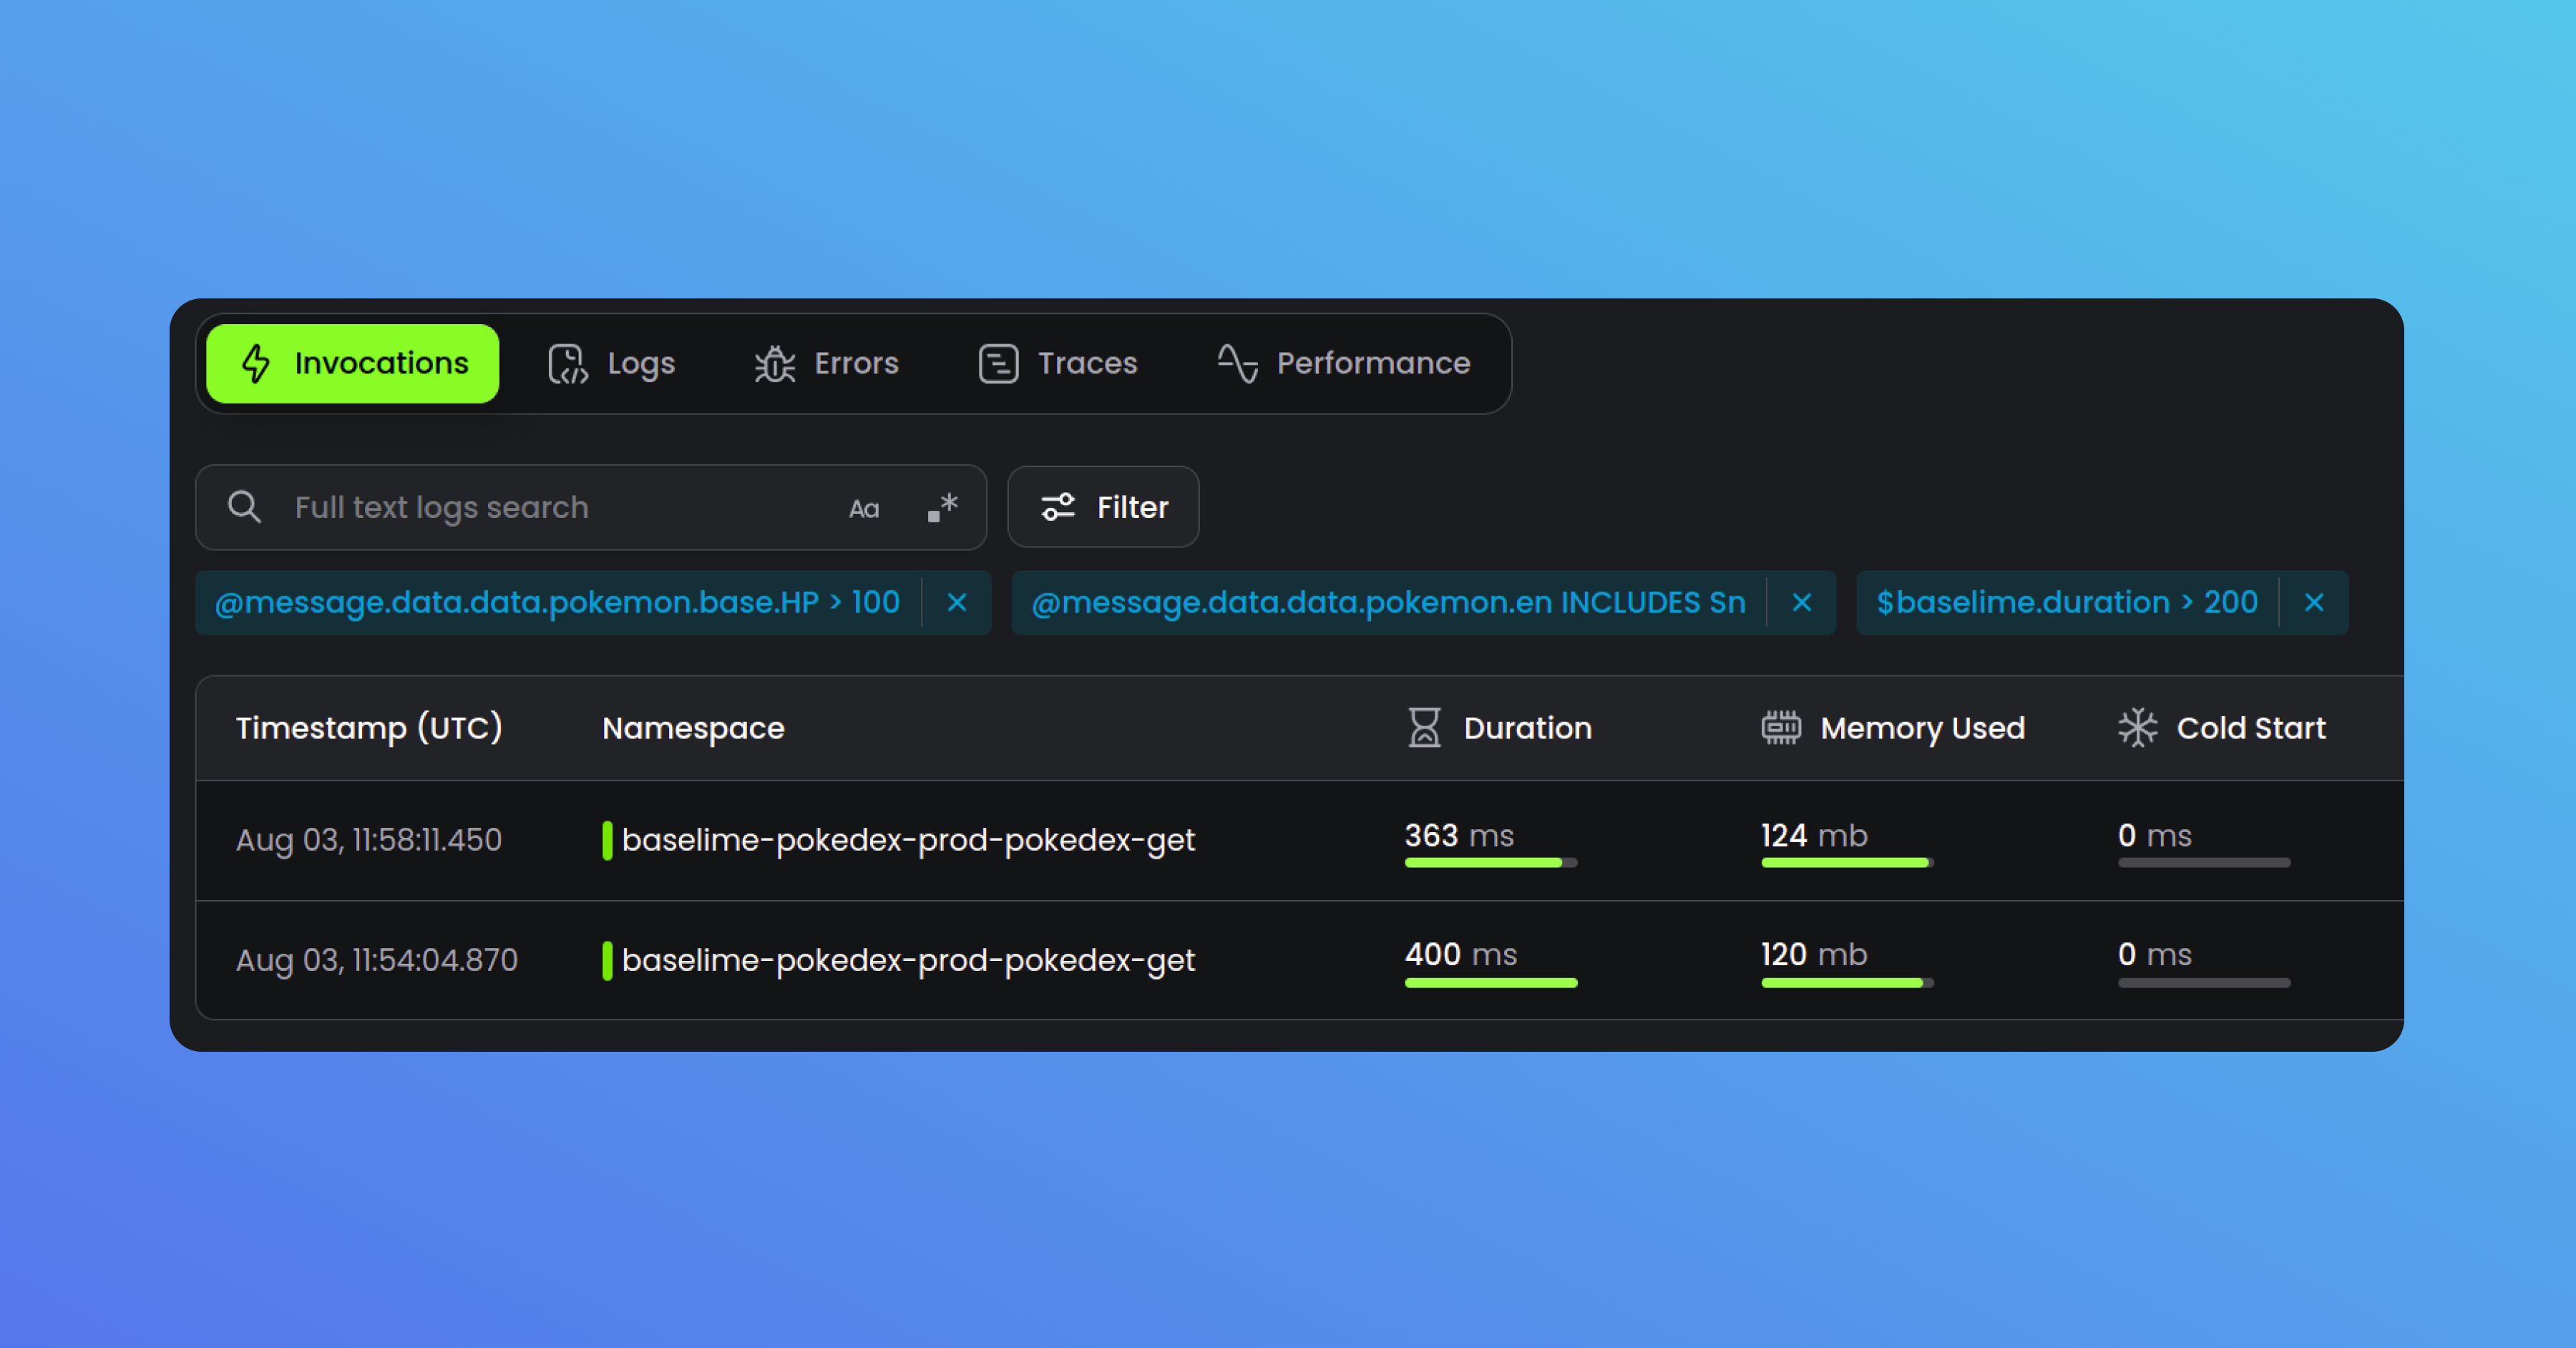
Invocation Filters
We are introducing a new invocation filter. You can now specify multiple filters, which are applied across all logs emitted by your AWS Lambda function, thereby enabling you to efficiently find all invocations matching the filters. The filters are applied to all the logs and the returned data is the set of invocations for which at least one log entry matches each filter.
This extends your filtering capabilities, making it easier to handle complex scenarios. Say goodbye to manual cross-log matching and enjoy a more streamlined observability process.
Logs Filters
You can now effortlessly filter logs of a specific AWS Lambda function without having to build a query. Simply navigate to the function screen and apply the desired filters directly. This enhancement simplifies the log filtering process, saving you valuable time and effort.
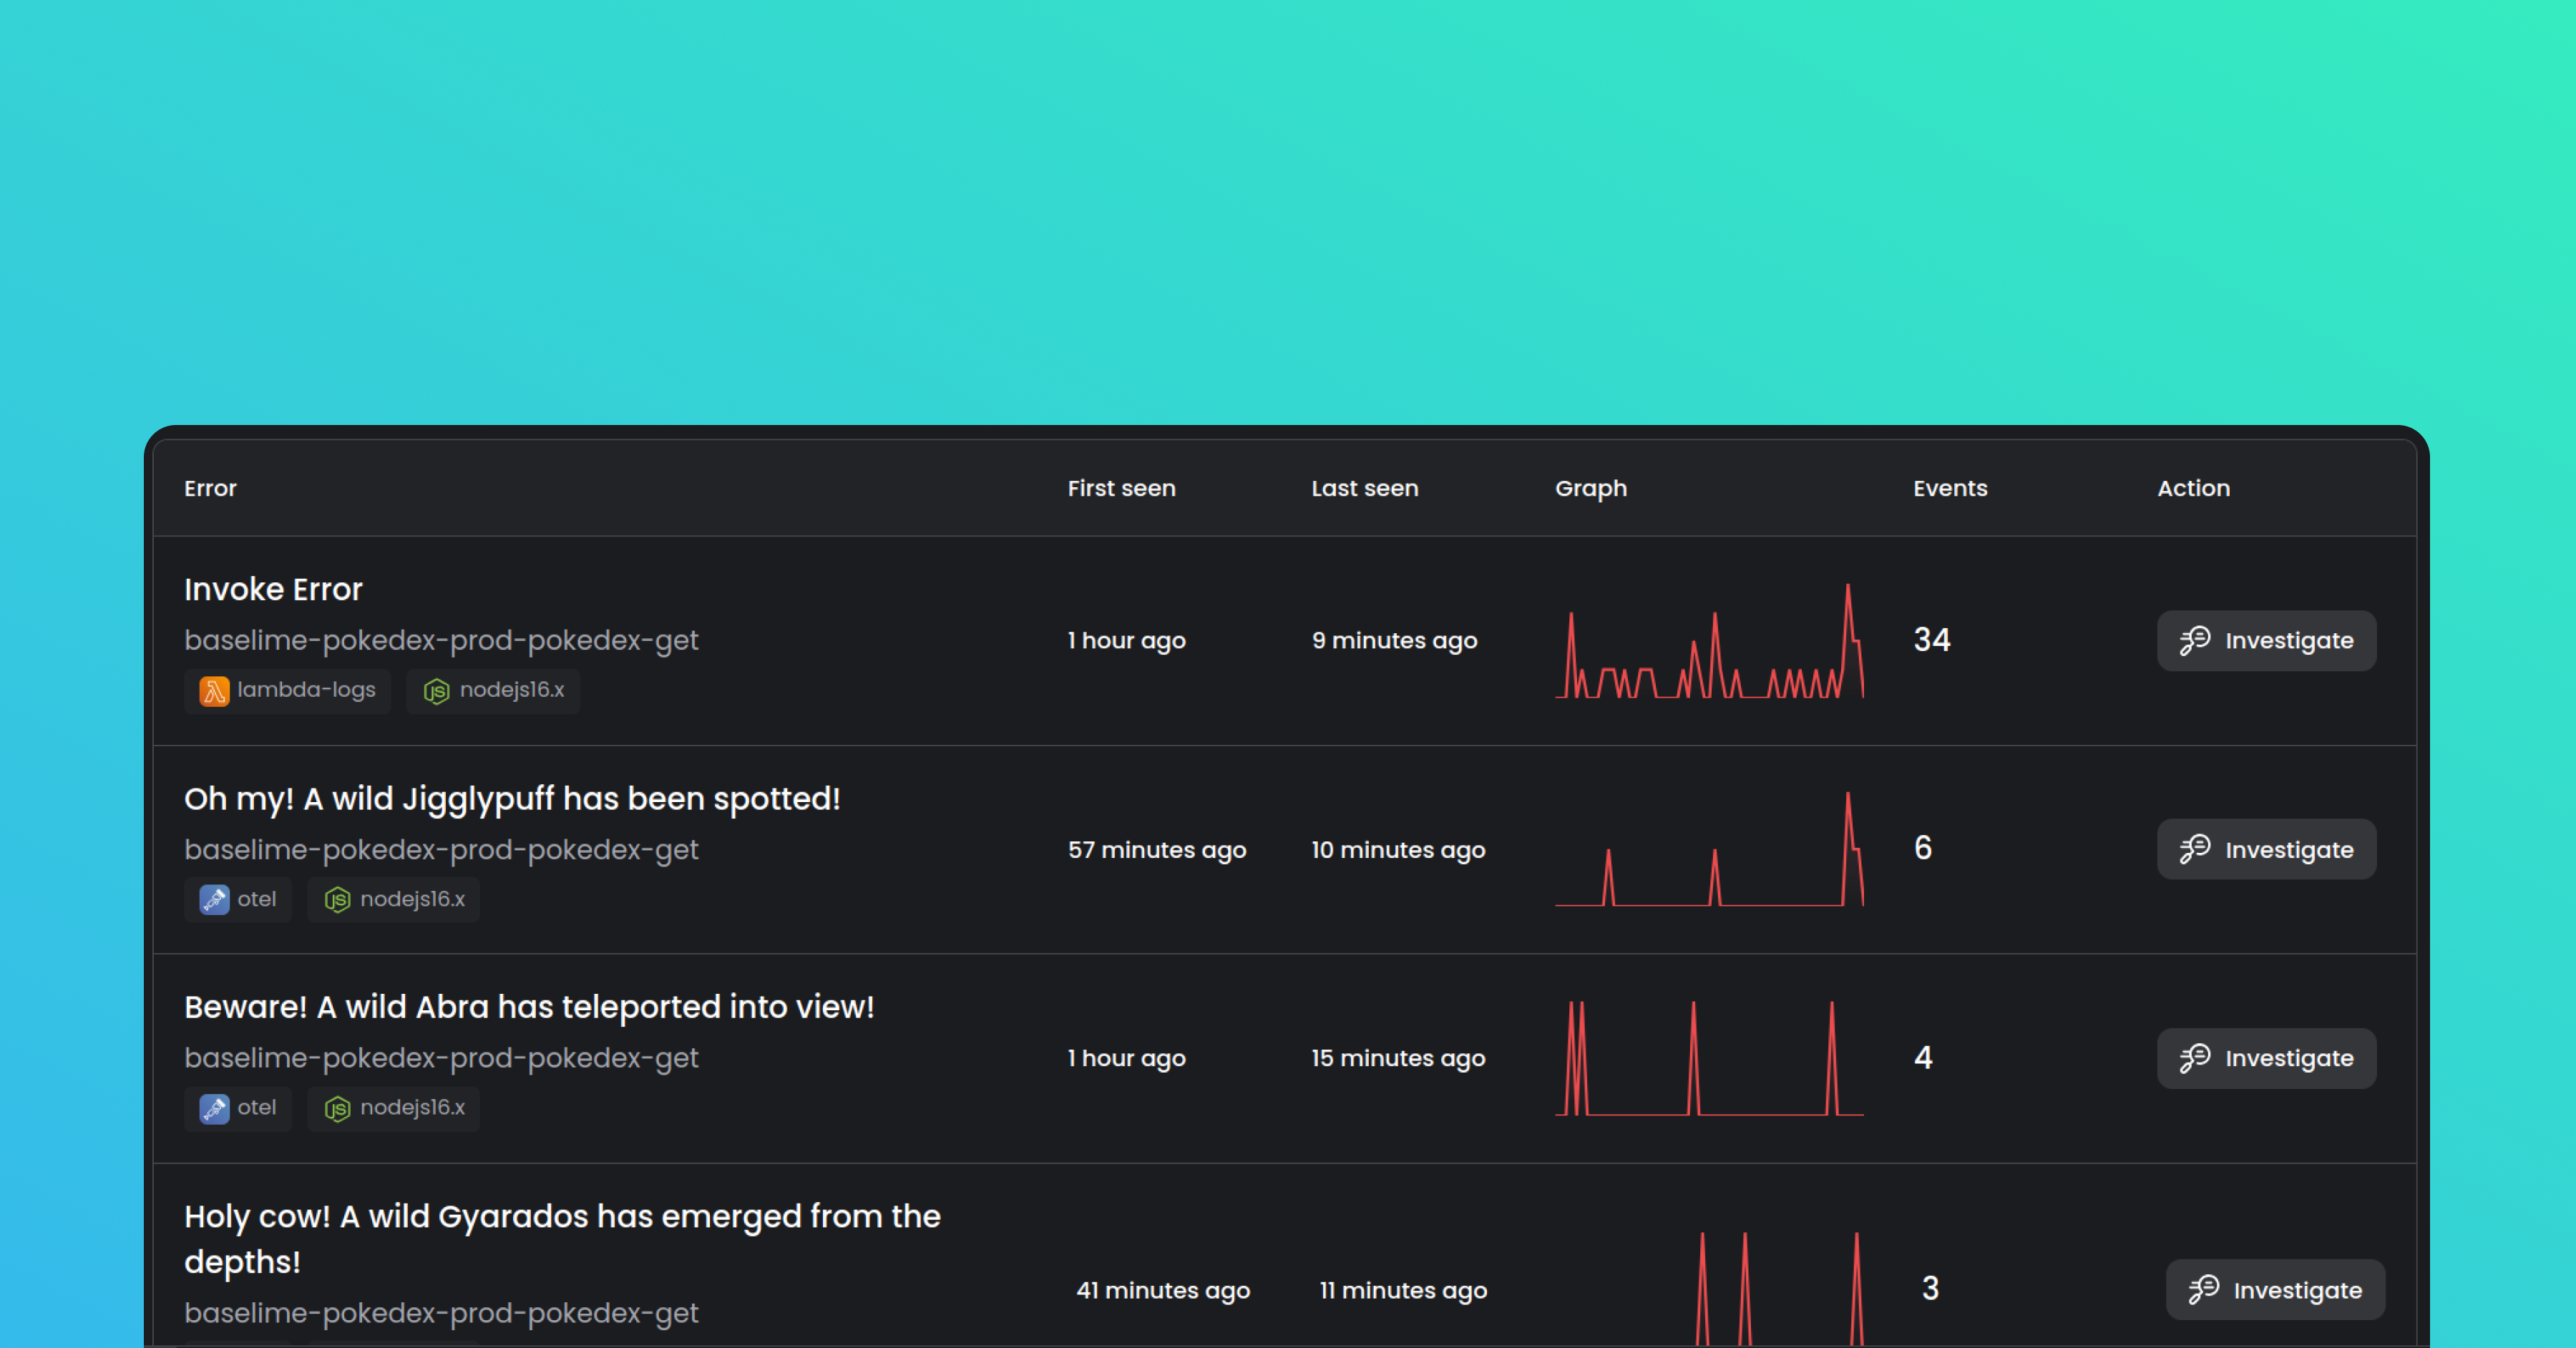
First Seen and Last Seen Errors
We have improved the errors tables for both the service and functions screens. Now, you can quickly identify the first and the last times an error was seen within the selected timeframe. This valuable information facilitates error triage, enabling you to pinpoint and resolve issues faster.
Improvements & Fixes
- Added display of the runtime and other details in the functions and errors table
- Improved the reliability of the auto-scaling of the ingestion pipelines
- Further improved the performance and reliability of the X-Ray ingestion
- Improved the reliability of the backend screenshot capabilities
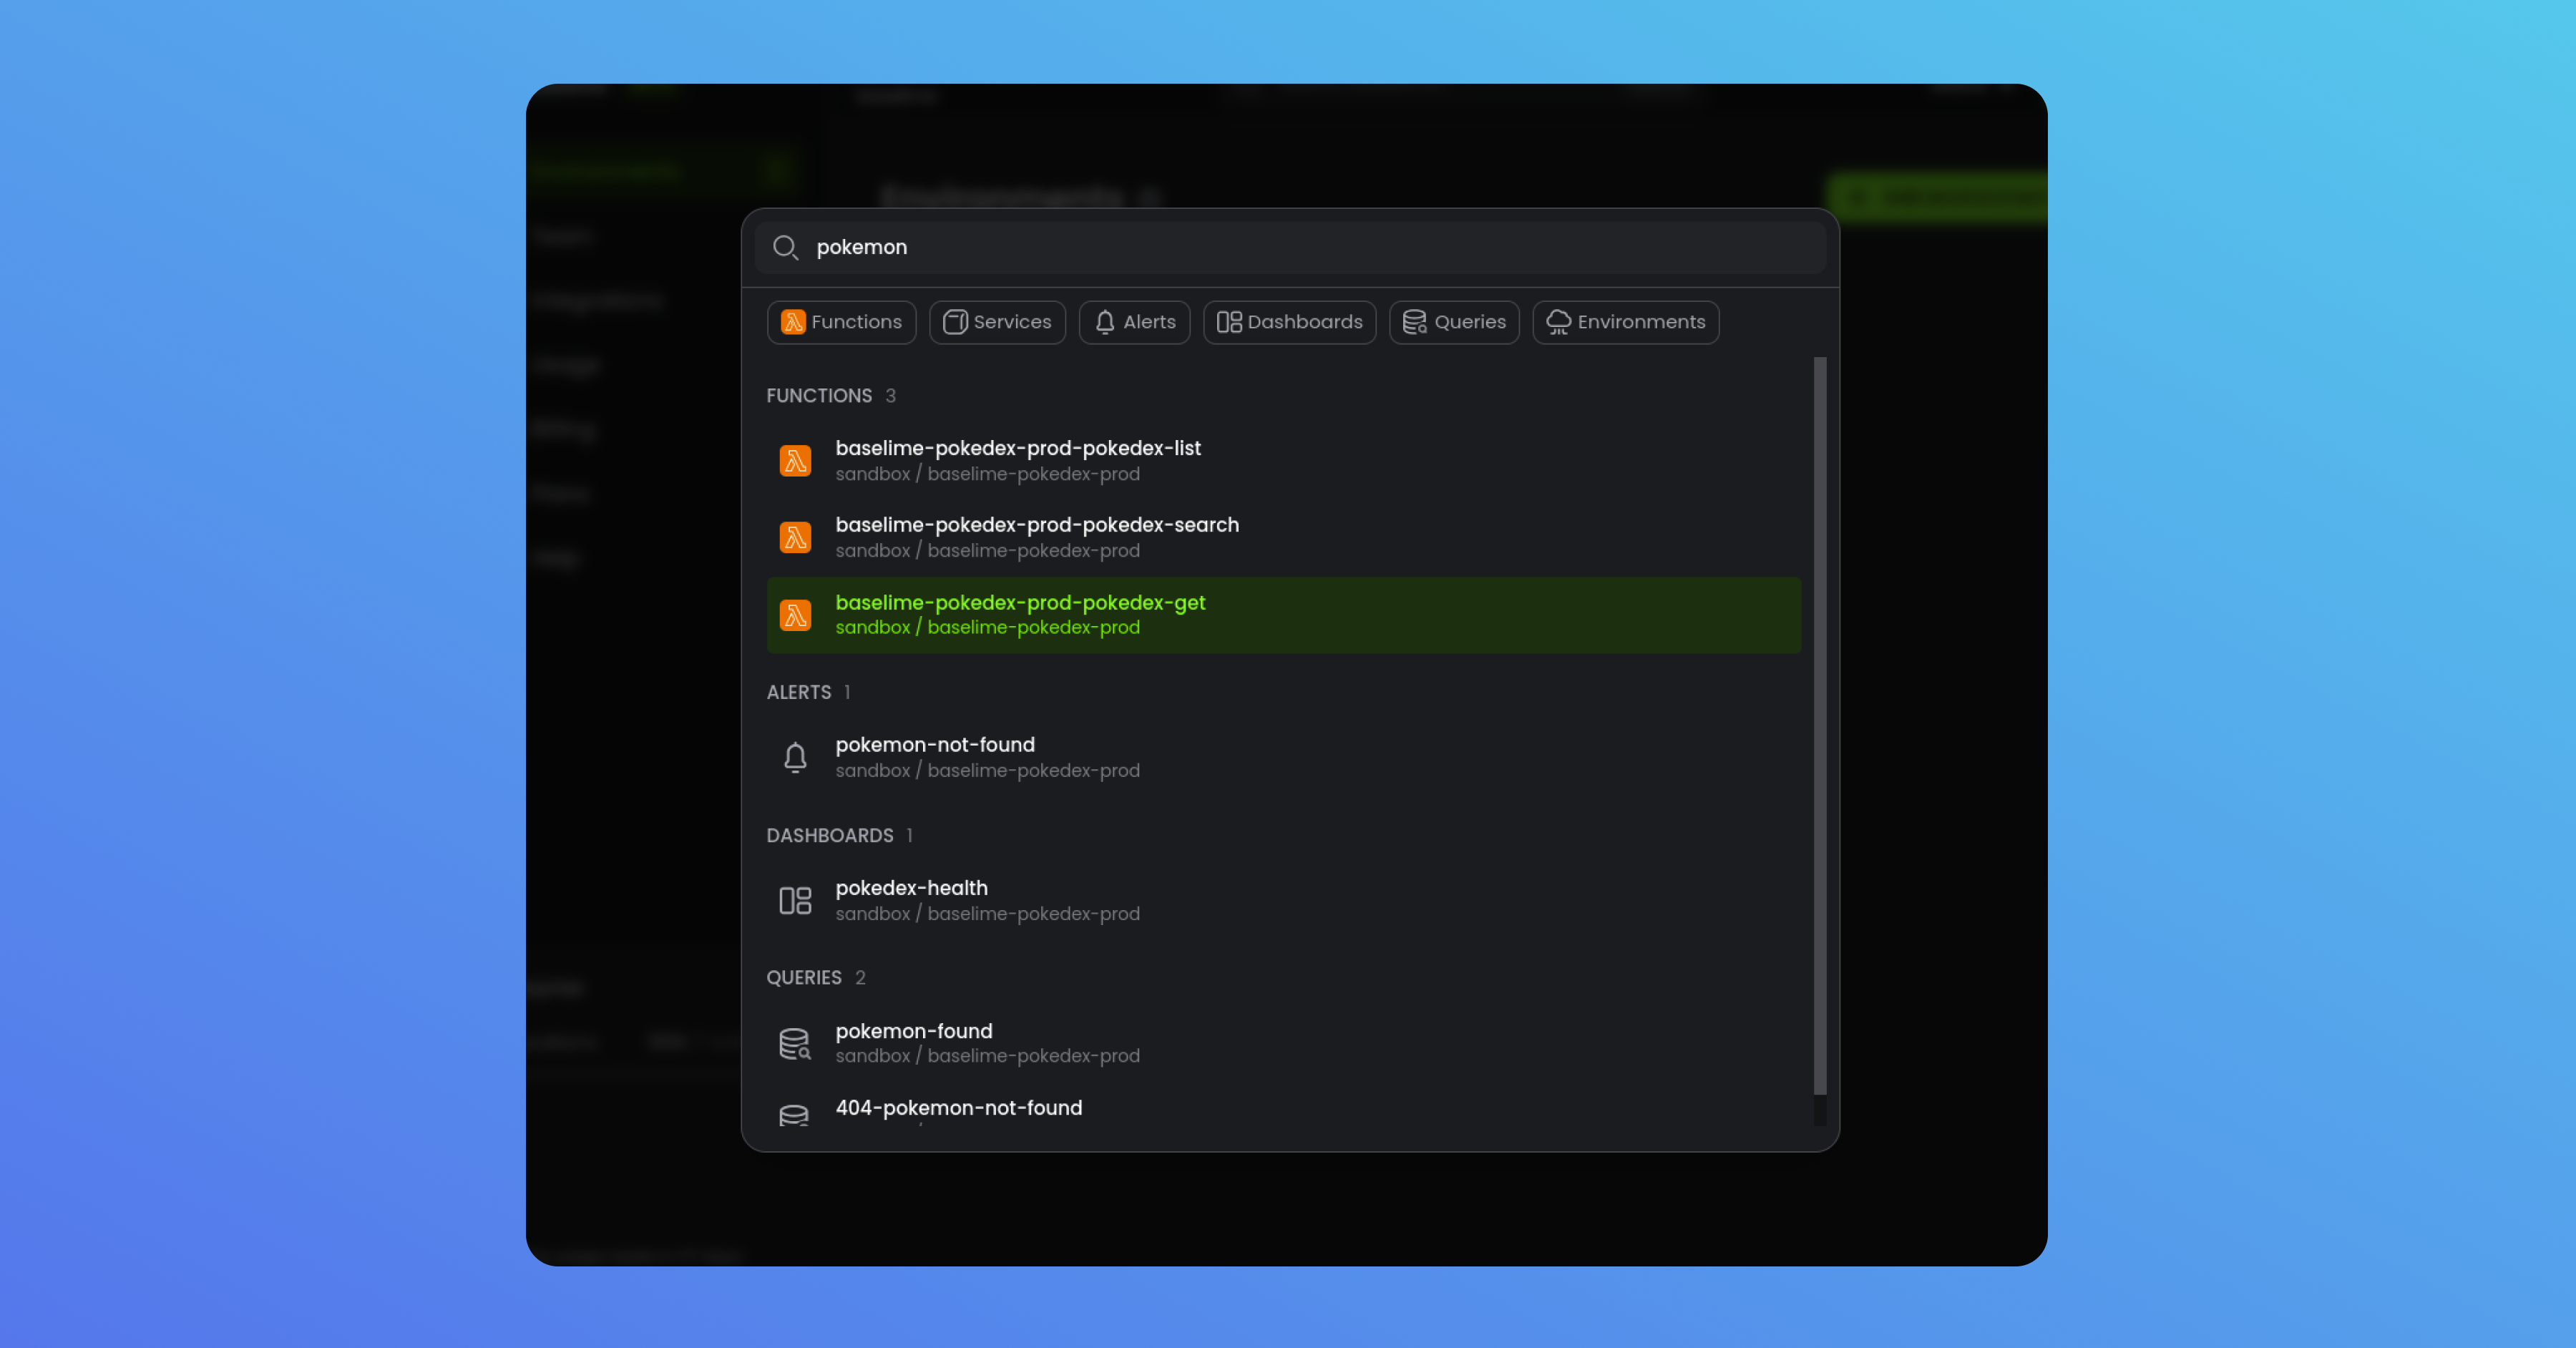
Command Bar for Observability
We’re thrilled to introduce the Command Bar, your new navigation companion for observability. Press a few buttons and jump from viewing a dashboard to exploring the traces of a function in a different AWS region. Goodbye tedious clicks, hello lightning-fast observability!
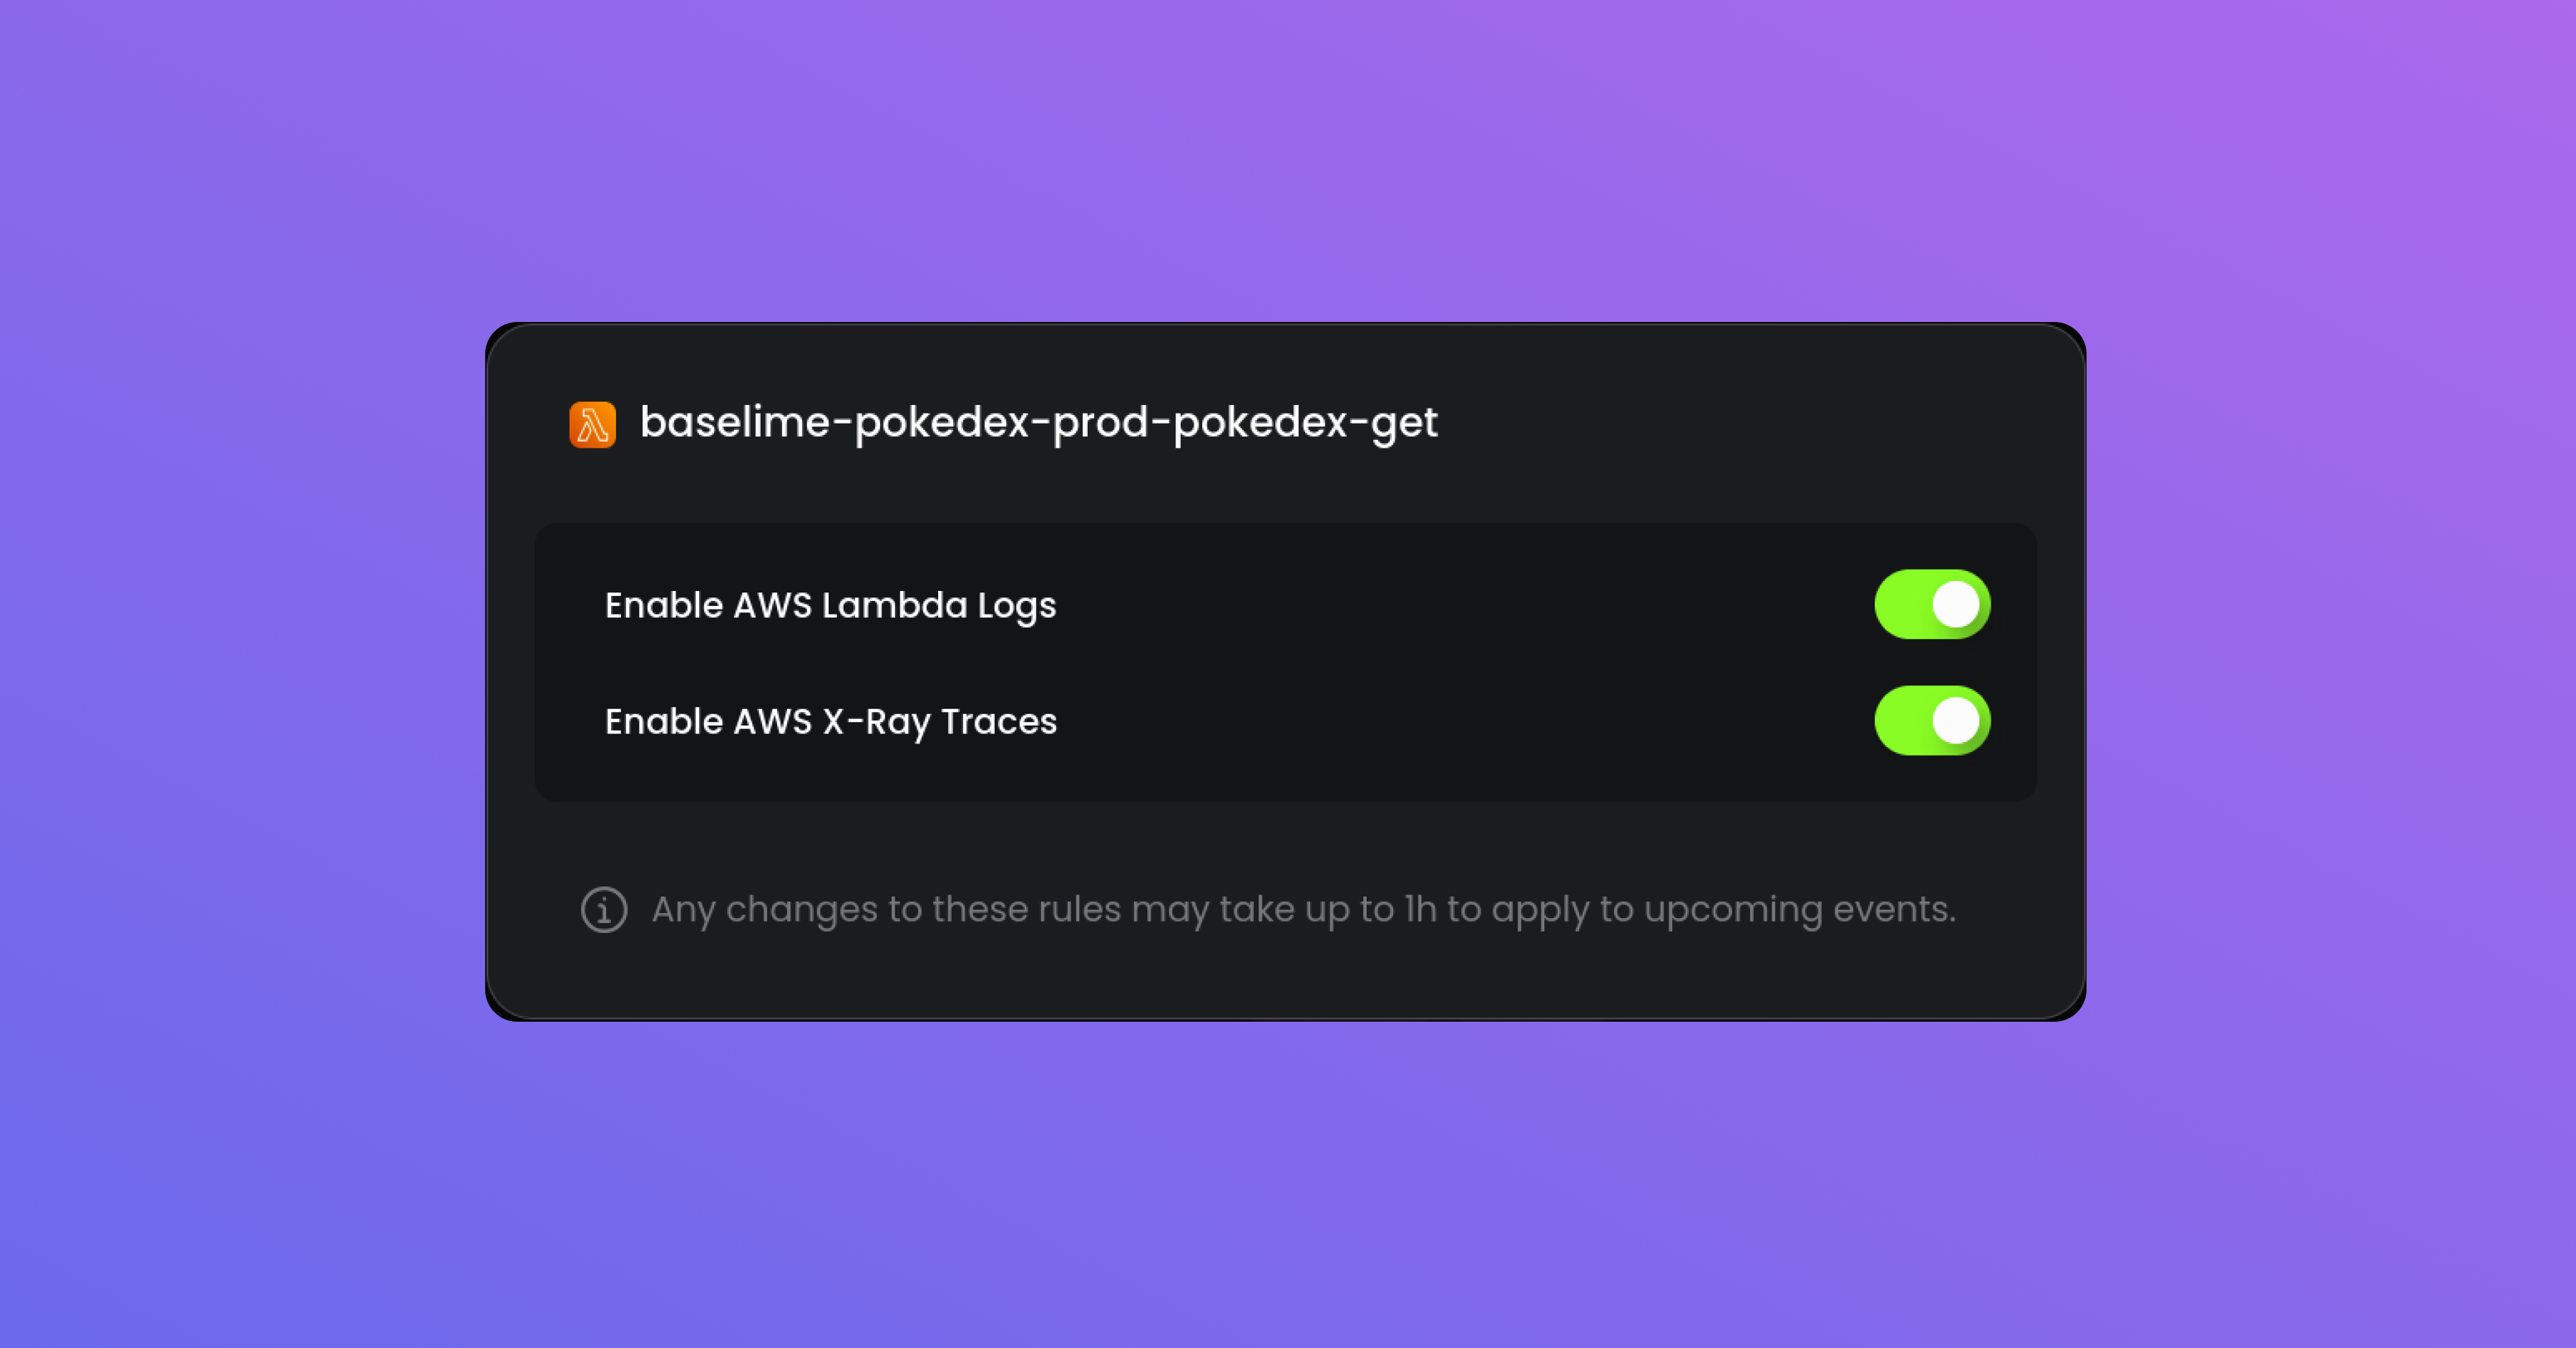
Data Ingestion Control for Individual AWS Lambda Functions
You asked, so we delivered. You now have the power to control the data ingestion for individual AWS Lambda functions. Tailor data flows to your specific needs, enabling you to fine-tune your observability and focus on what matters most to you.
Cost Projections for AWS Lambda Functions
Curious about the projected cost of your AWS Lambda functions? Look no further, the inventory table now shows the projected cost of each function individually - this assumes the number of invocations and durations remain constant for the rest of the month. Stay on top of your budget and avoid surprises, particularly when you make changes.
Percentage Changes for Metrics
Metrics matter, and now you can track how they fluctuate. Both the inventory table and the summary charts provide the current value of metrics, such as latencies and number of errors, along with the % change from the previous timeframe. Stay informed and spot trends at a glance.
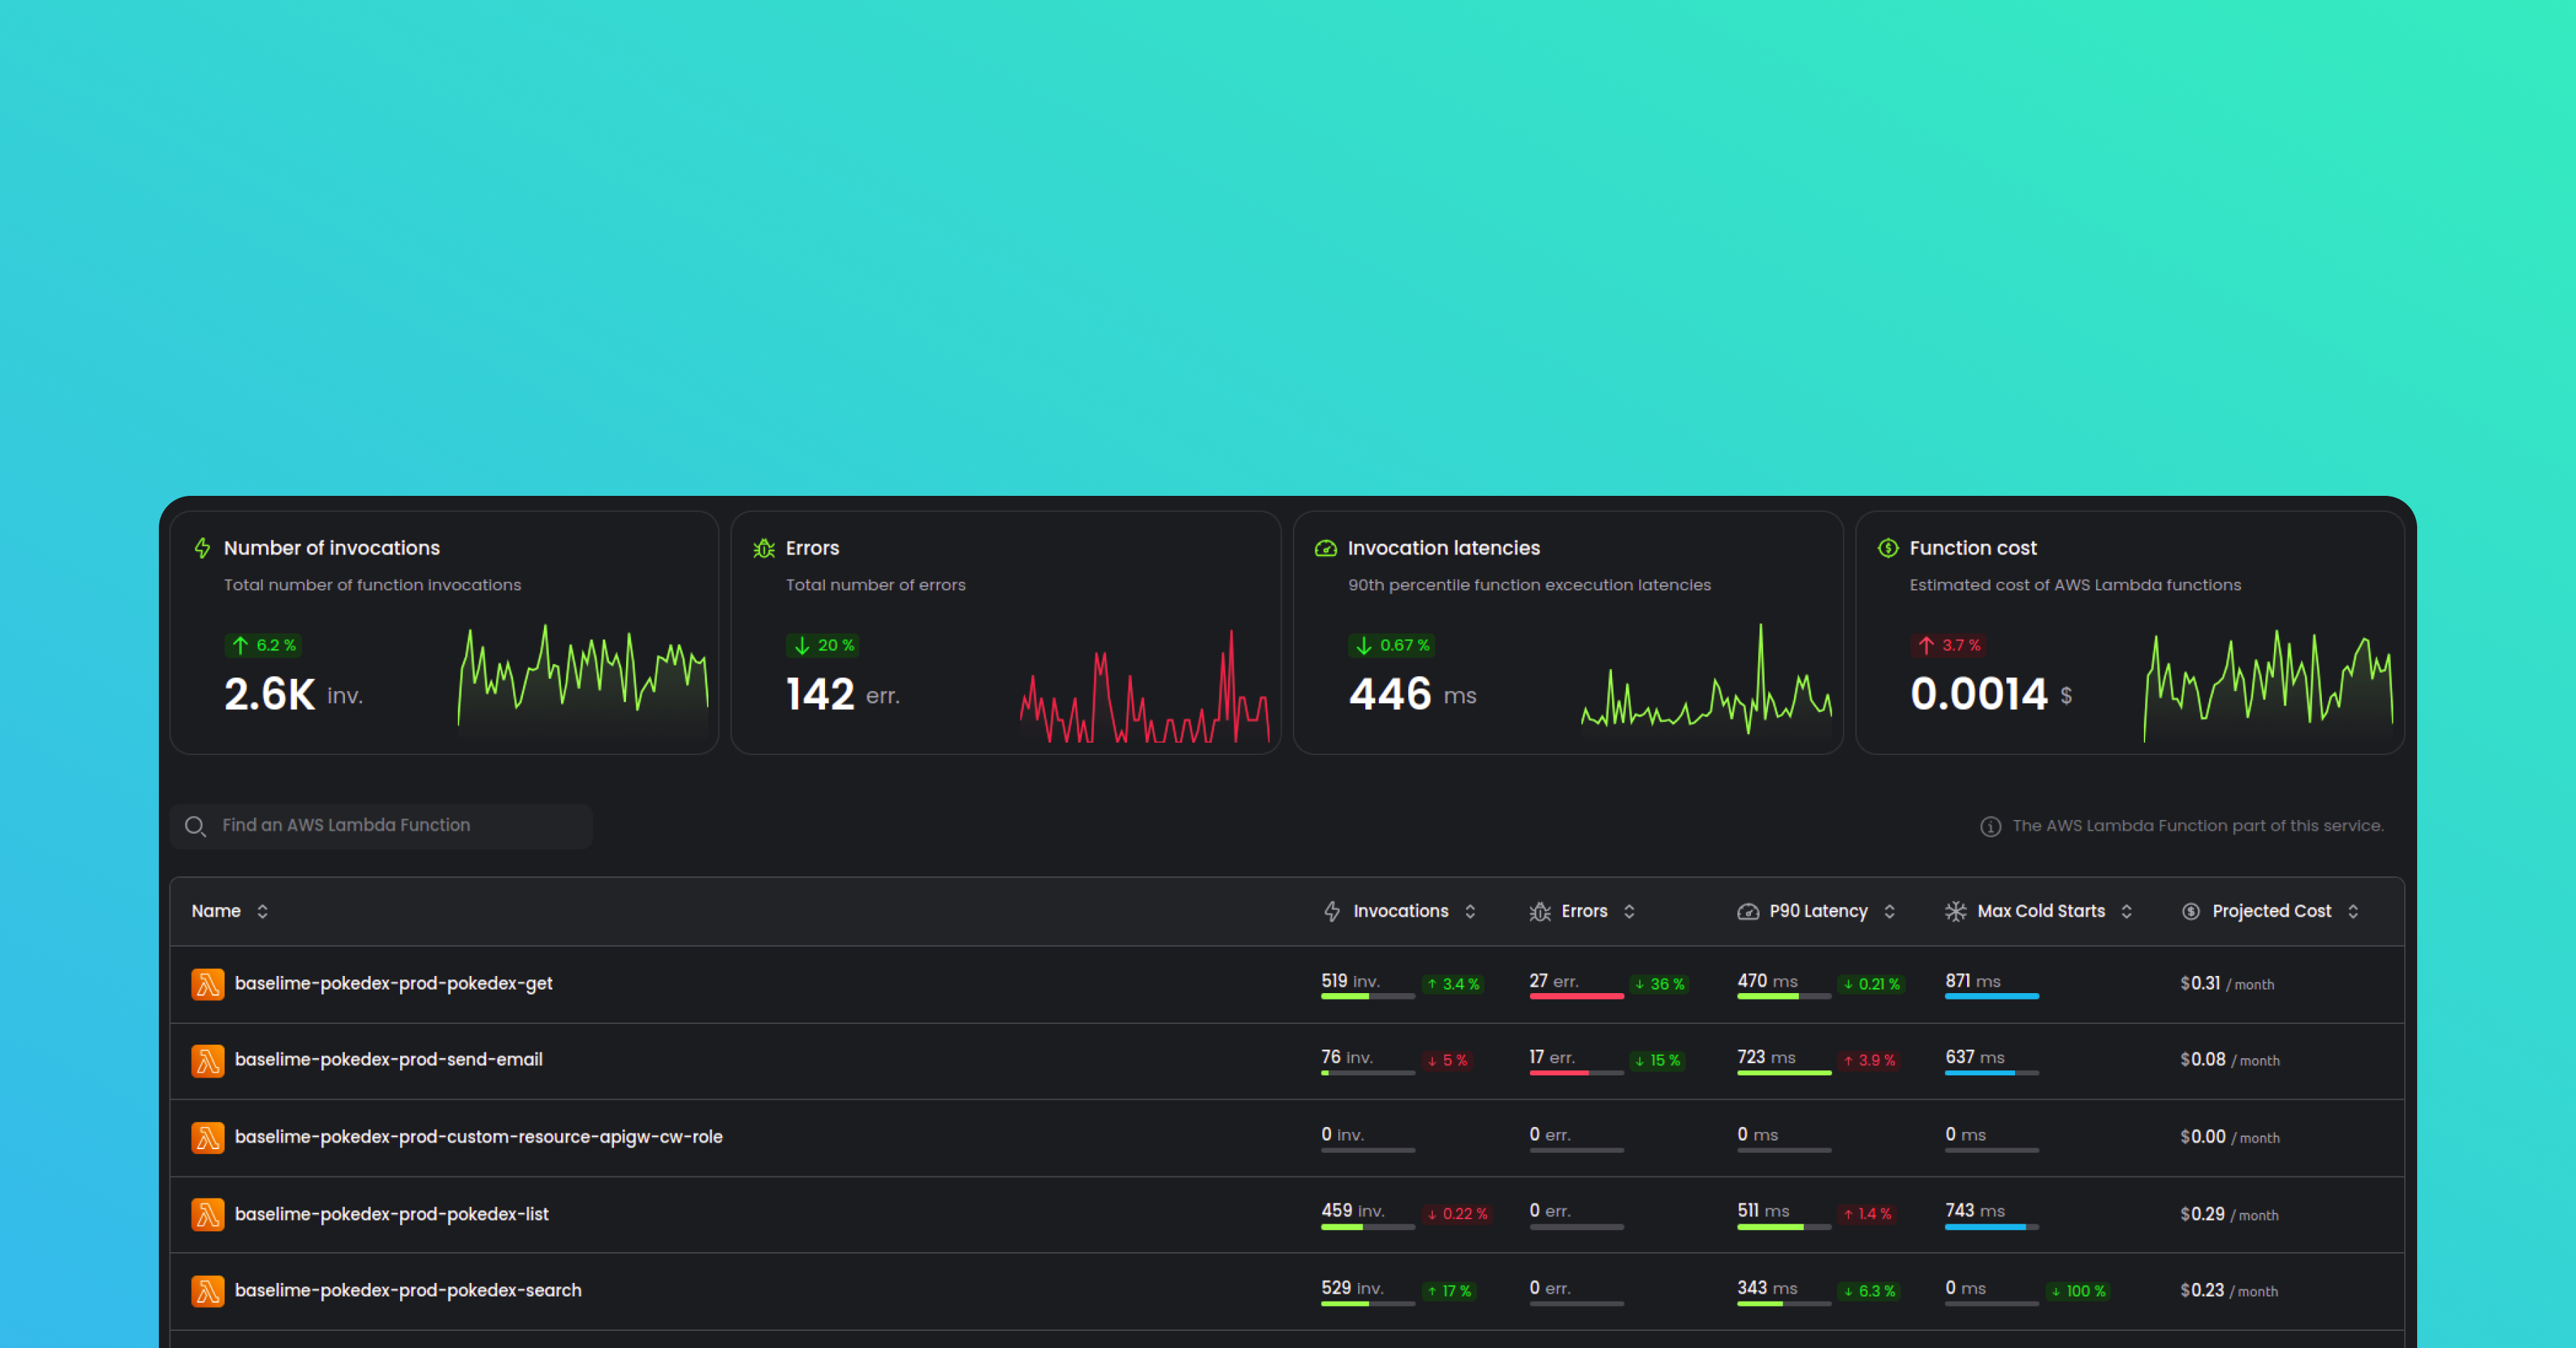
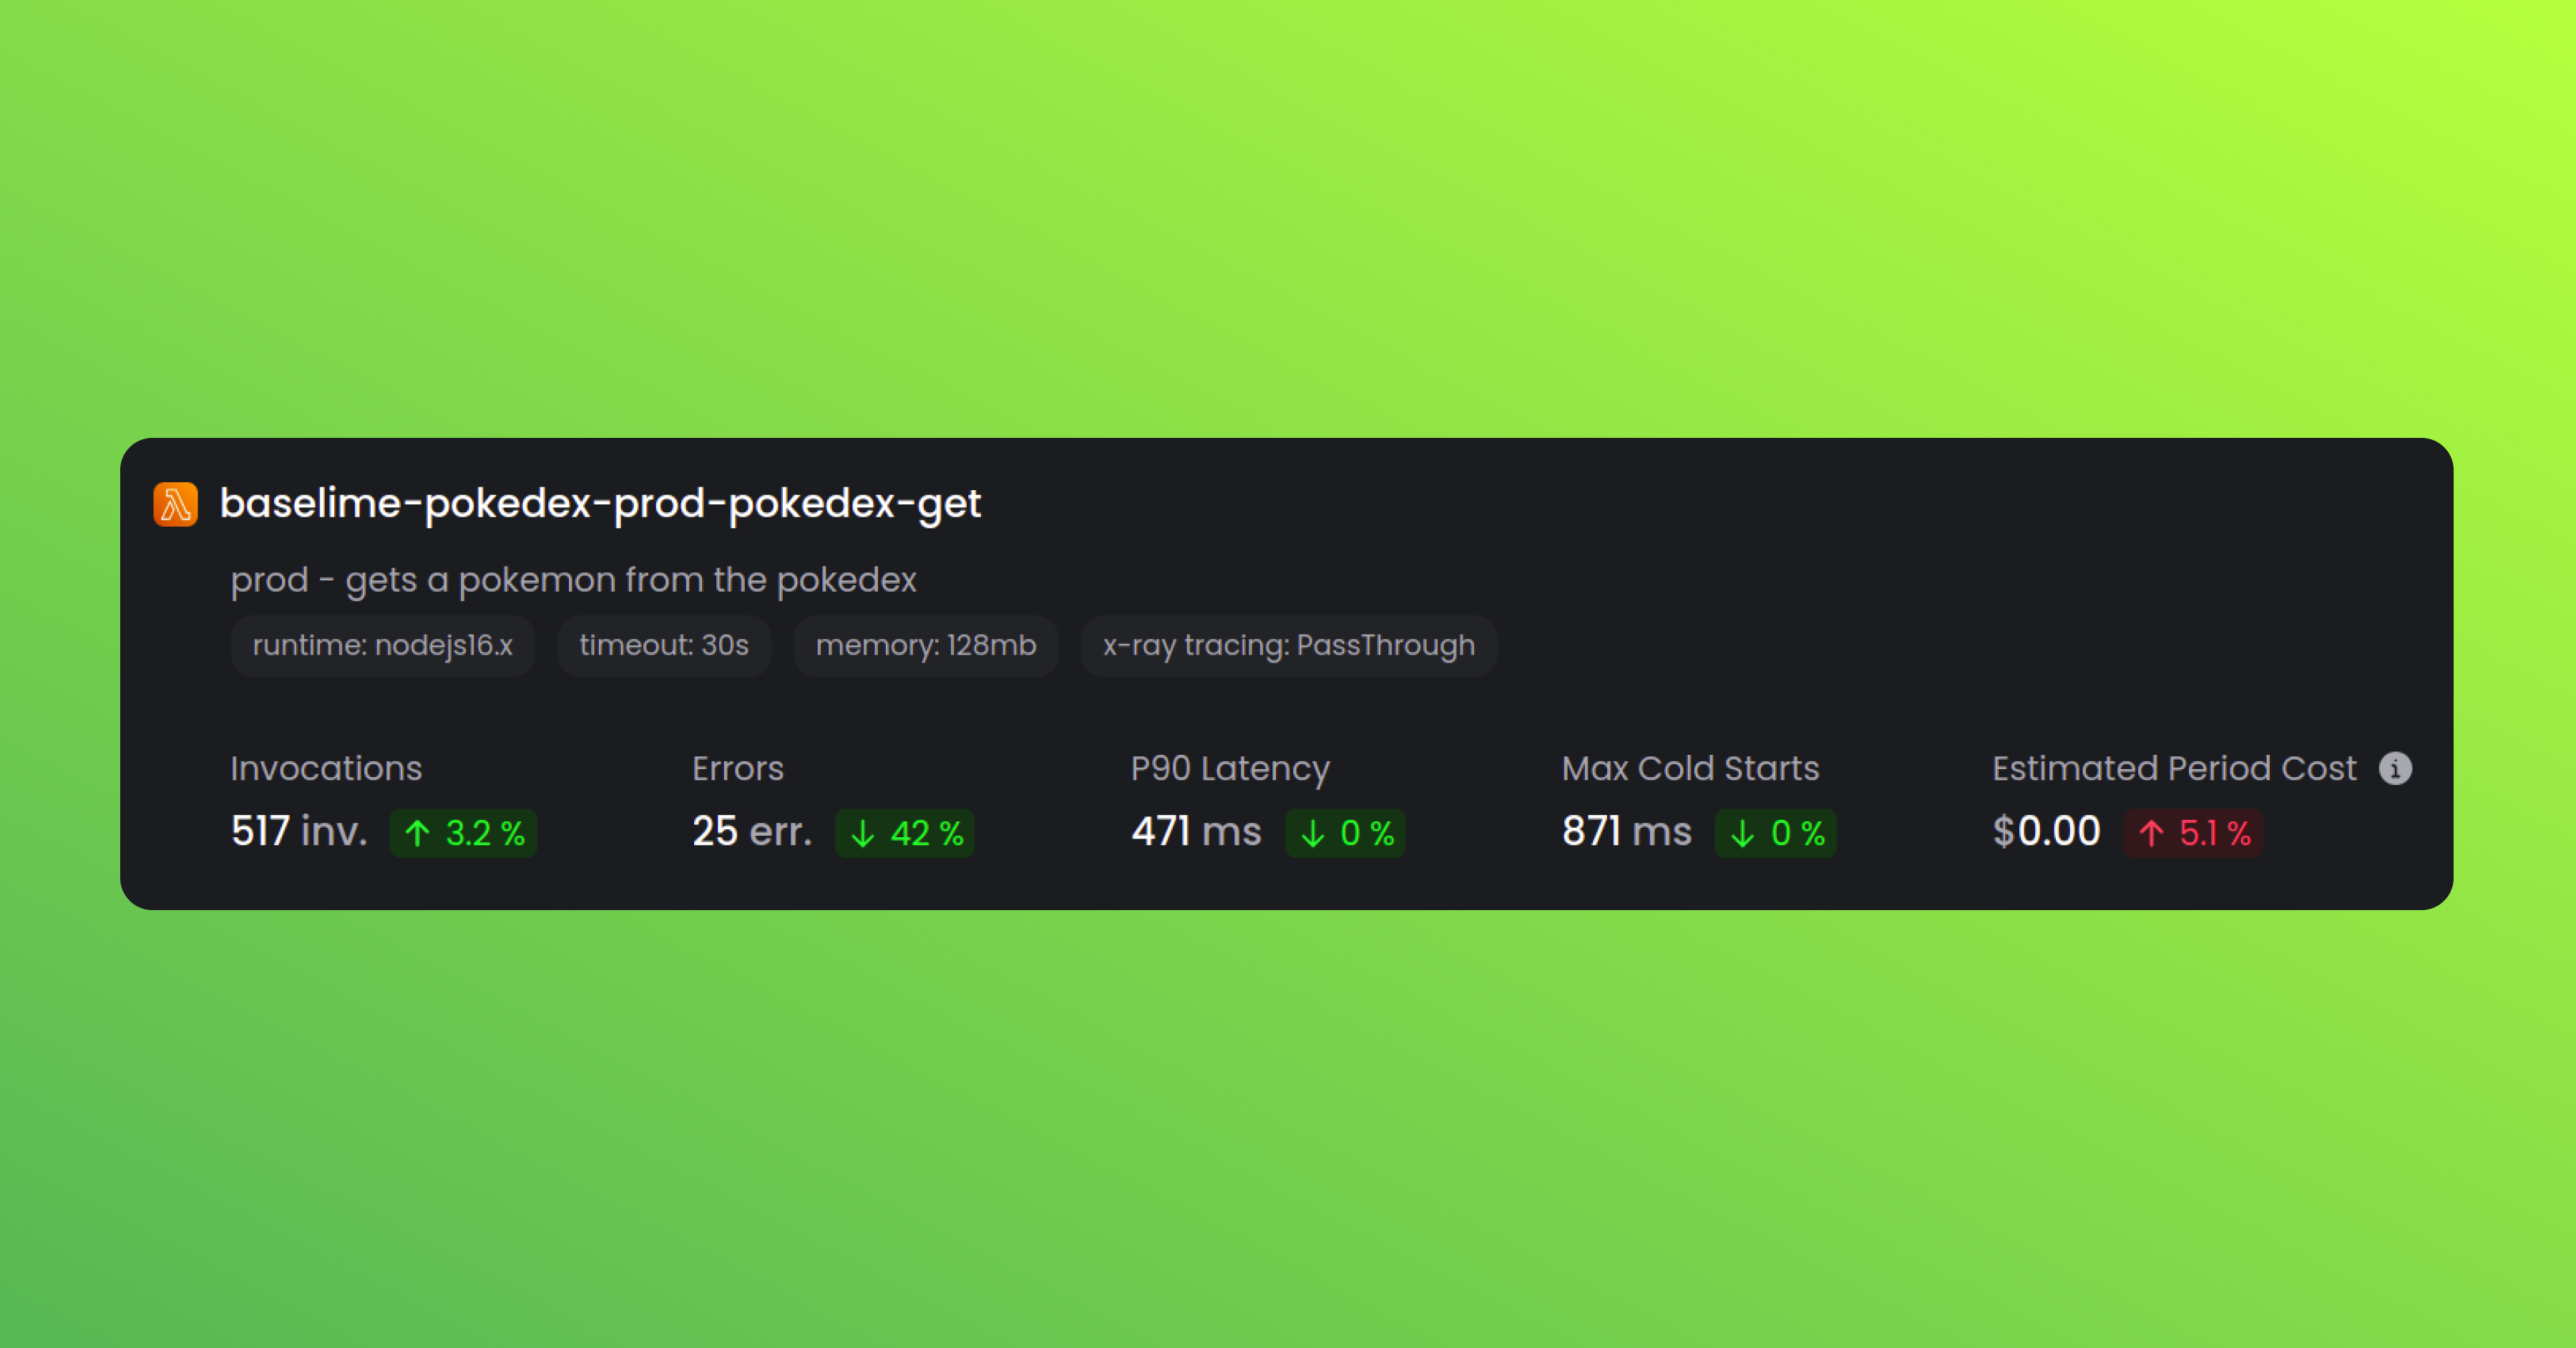
Function Level Stats
Dig deeper into your functions with our new function screen. Gain valuable insights into the number of invocations, errors, and other important stats directly from the function view. Uncover hidden patterns and optimize your code for peak performance.
Improvements & Fixes
- Changed the percentile computations to return the exact value instead of close approximations
- Further improved performance and reliability of the AWS X-Ray traces ingestion
- Changed the latencies through the console to consistently display 90th percentiles
- Fixed OpenTelemetry tracing for callback-based AWS Lambda functions
- Fixed defect where auto-instrumentation with no API Key would result in failures