Proactive Cold Starts
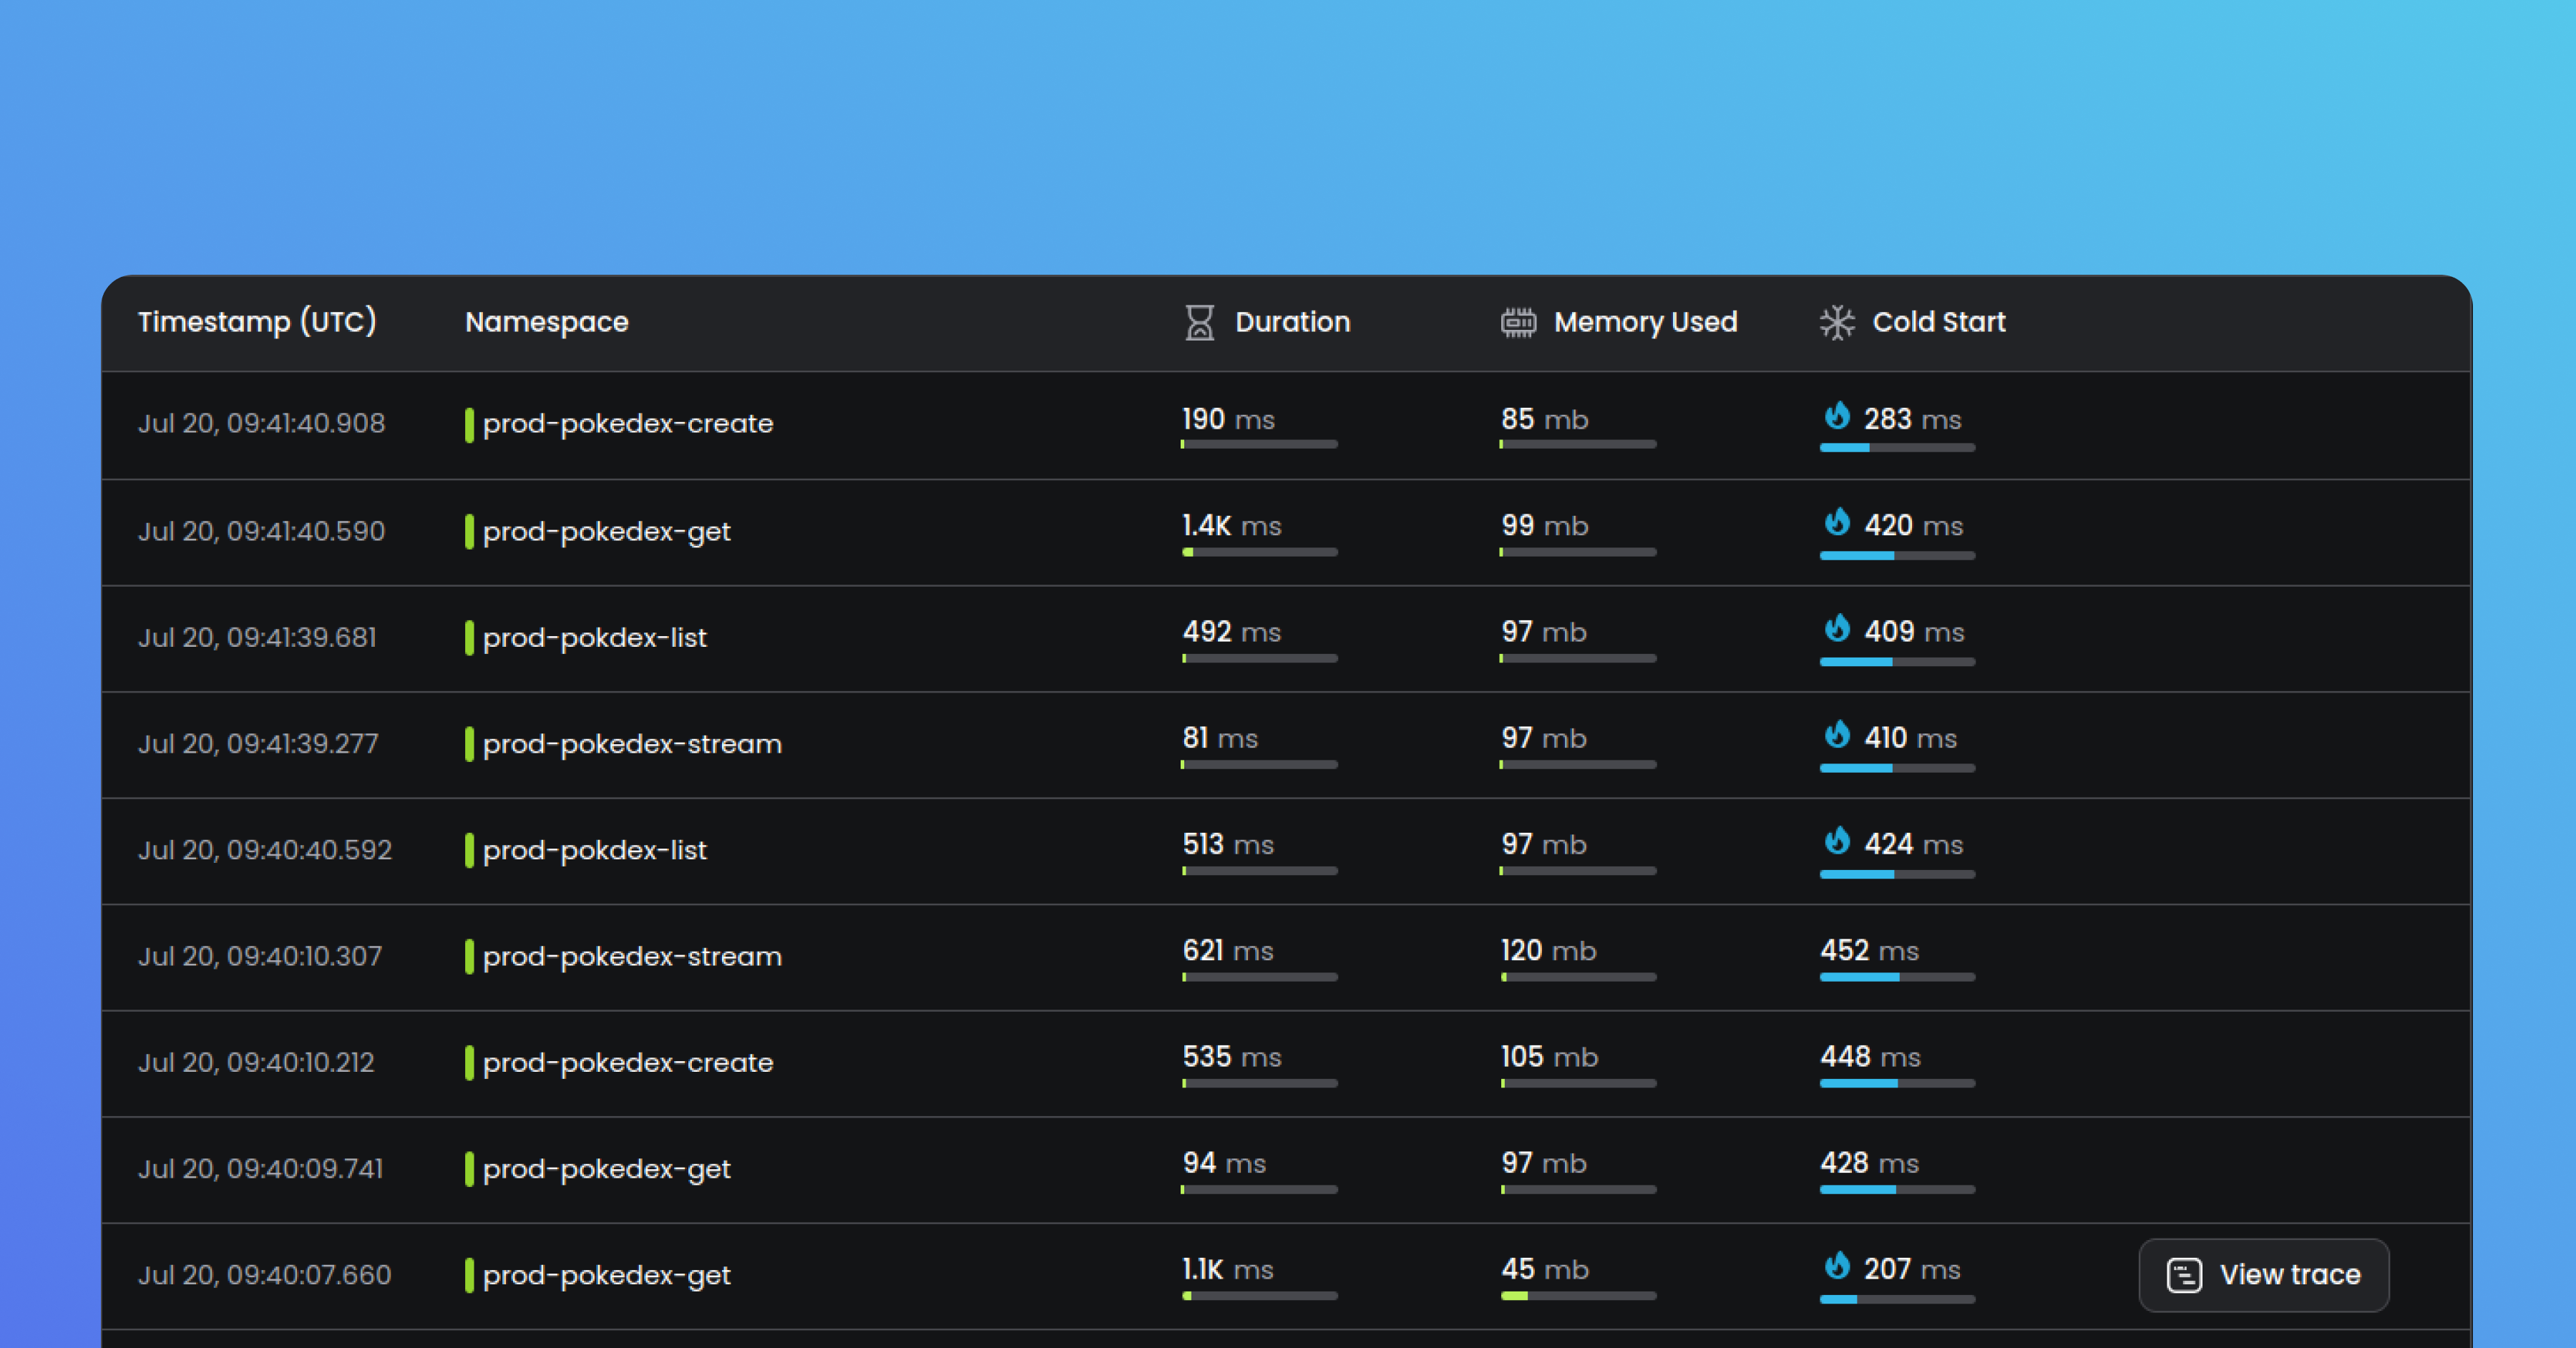
We’ve been closely monitoring AWS cold start behaviour and noticed a new trend a few months ago. AWS has now documented this behaviour, and we’ve incorporated it into Baselime. Are all cold starts are the same? Nope, some are warmer than others and that’s why we now highlight the warm cold-starts in the Baselime console with a 🔥 icon. This proactive approach helps you identify and optimize the performance of your functions effectively.
AND / OR Filters Support
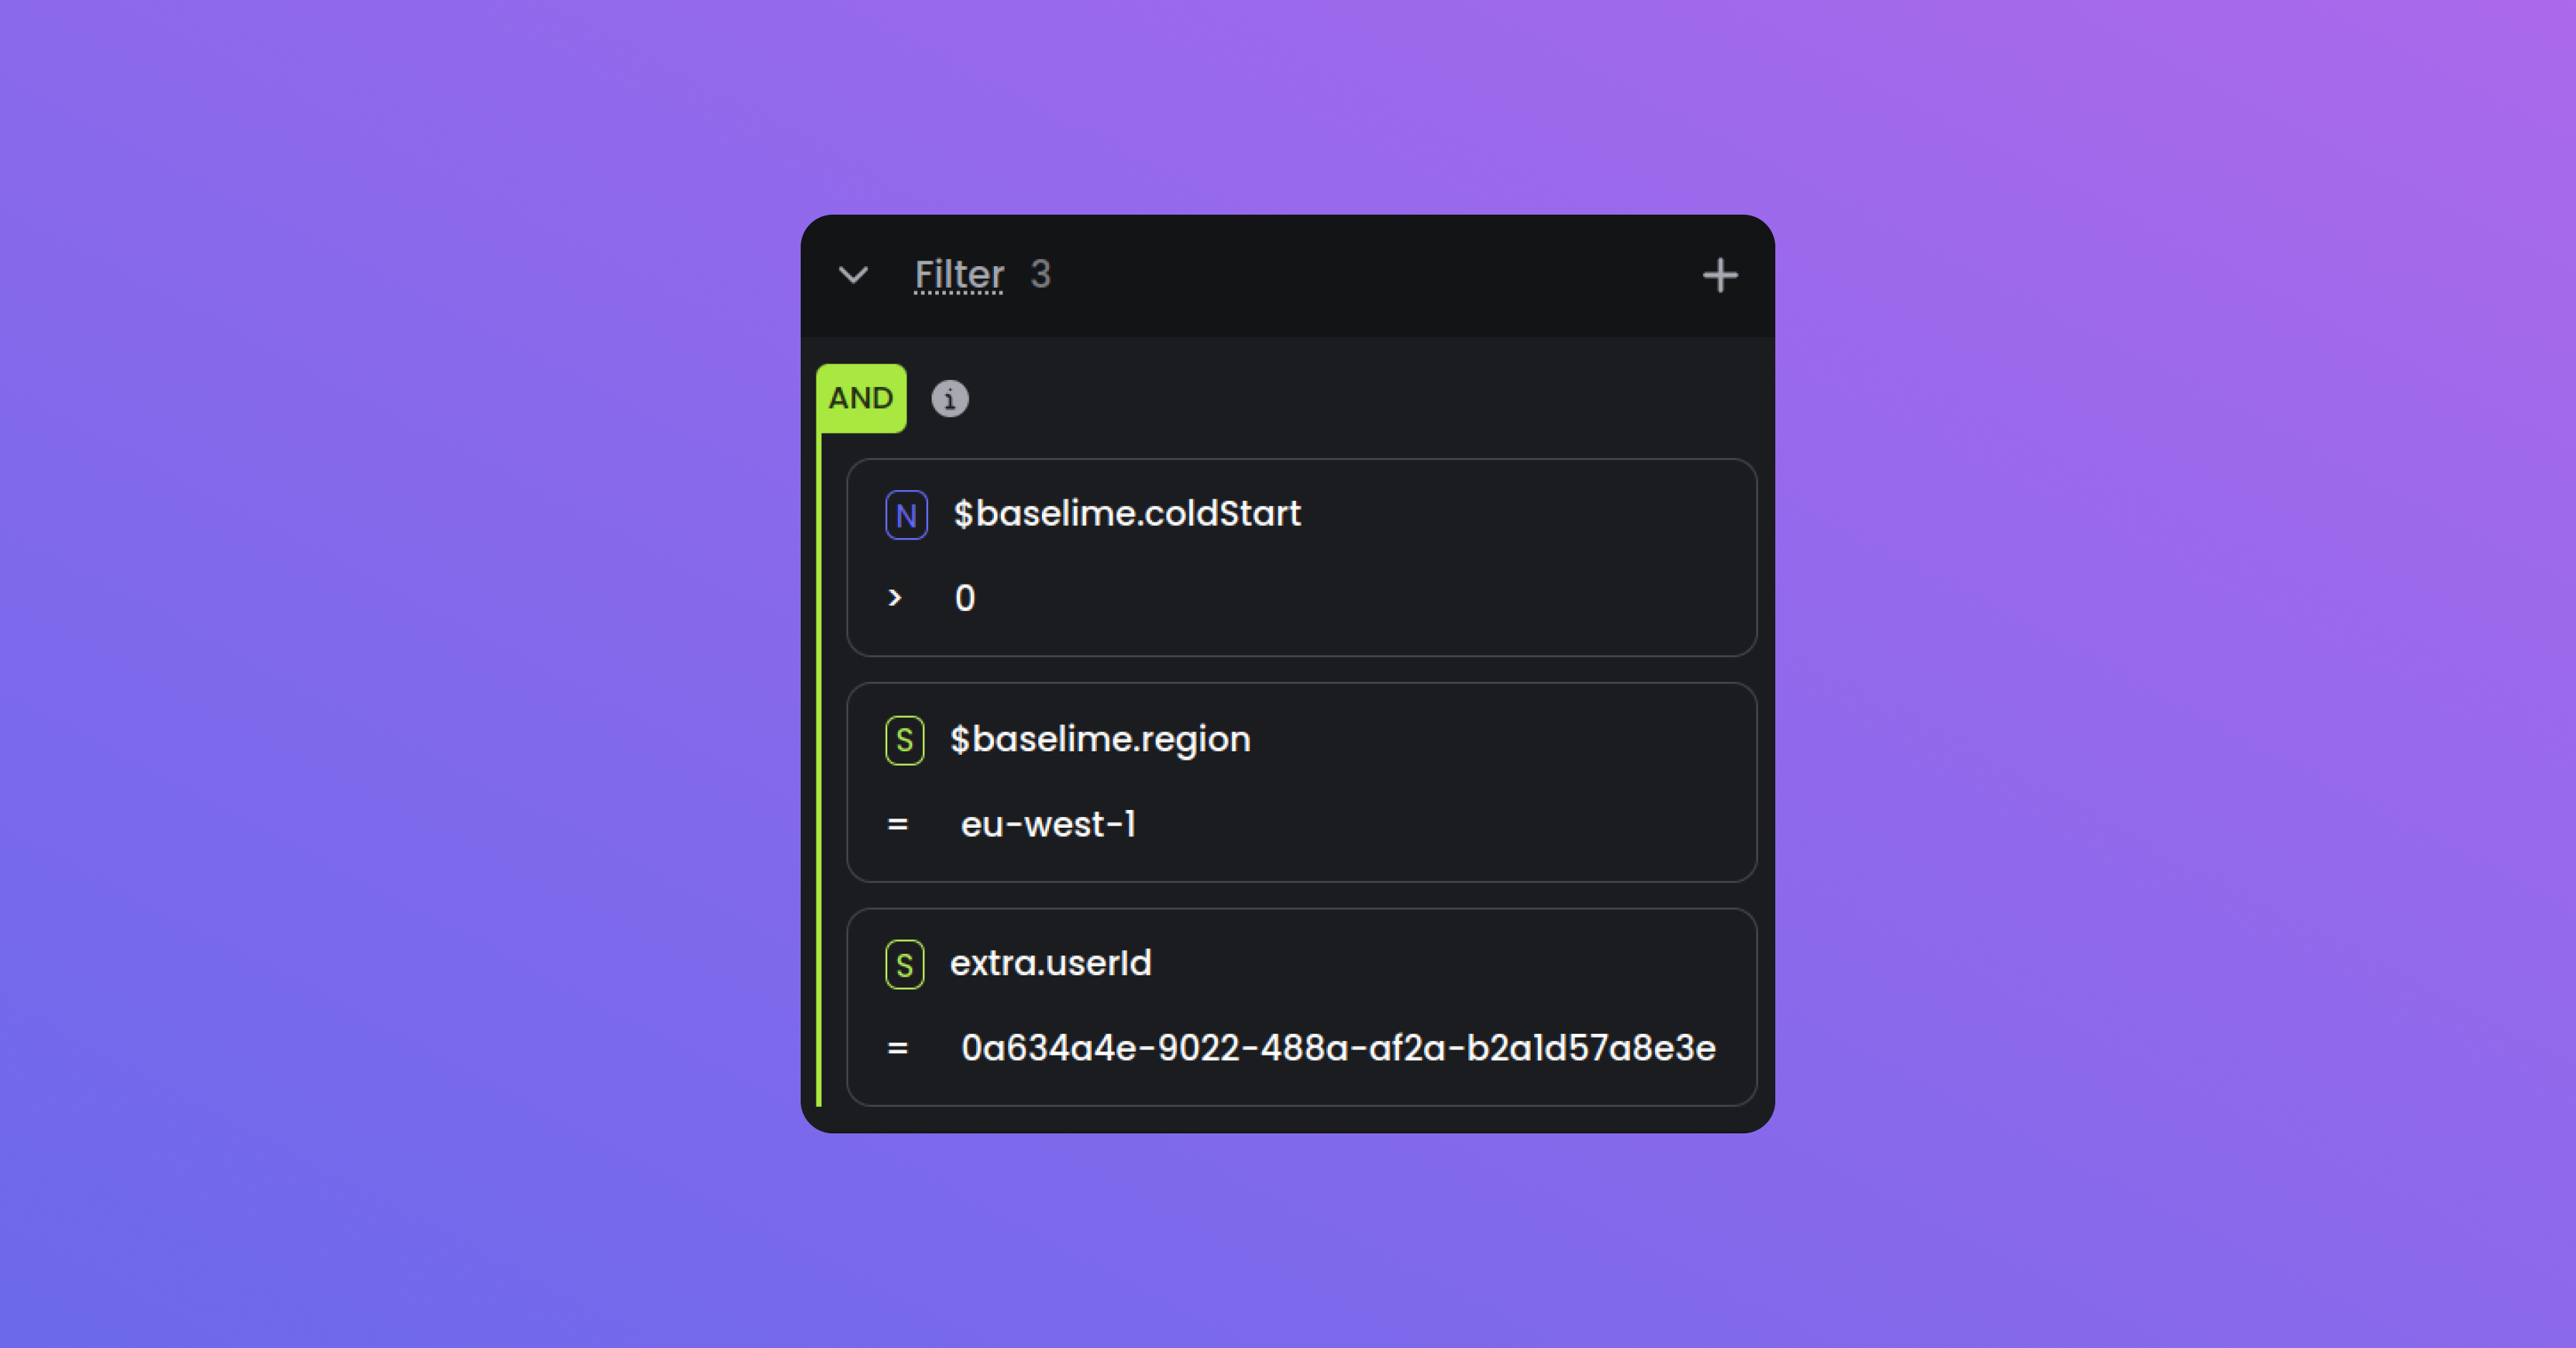
We added a highly requested feature: support for AND / OR filters in your queries. Now, when you have multiple filters in a query, you can choose to combine them with either AND or OR. This enables you to fine-tune your queries and ask your telemetry data a wider range of questions.
Simplified Inventory Table
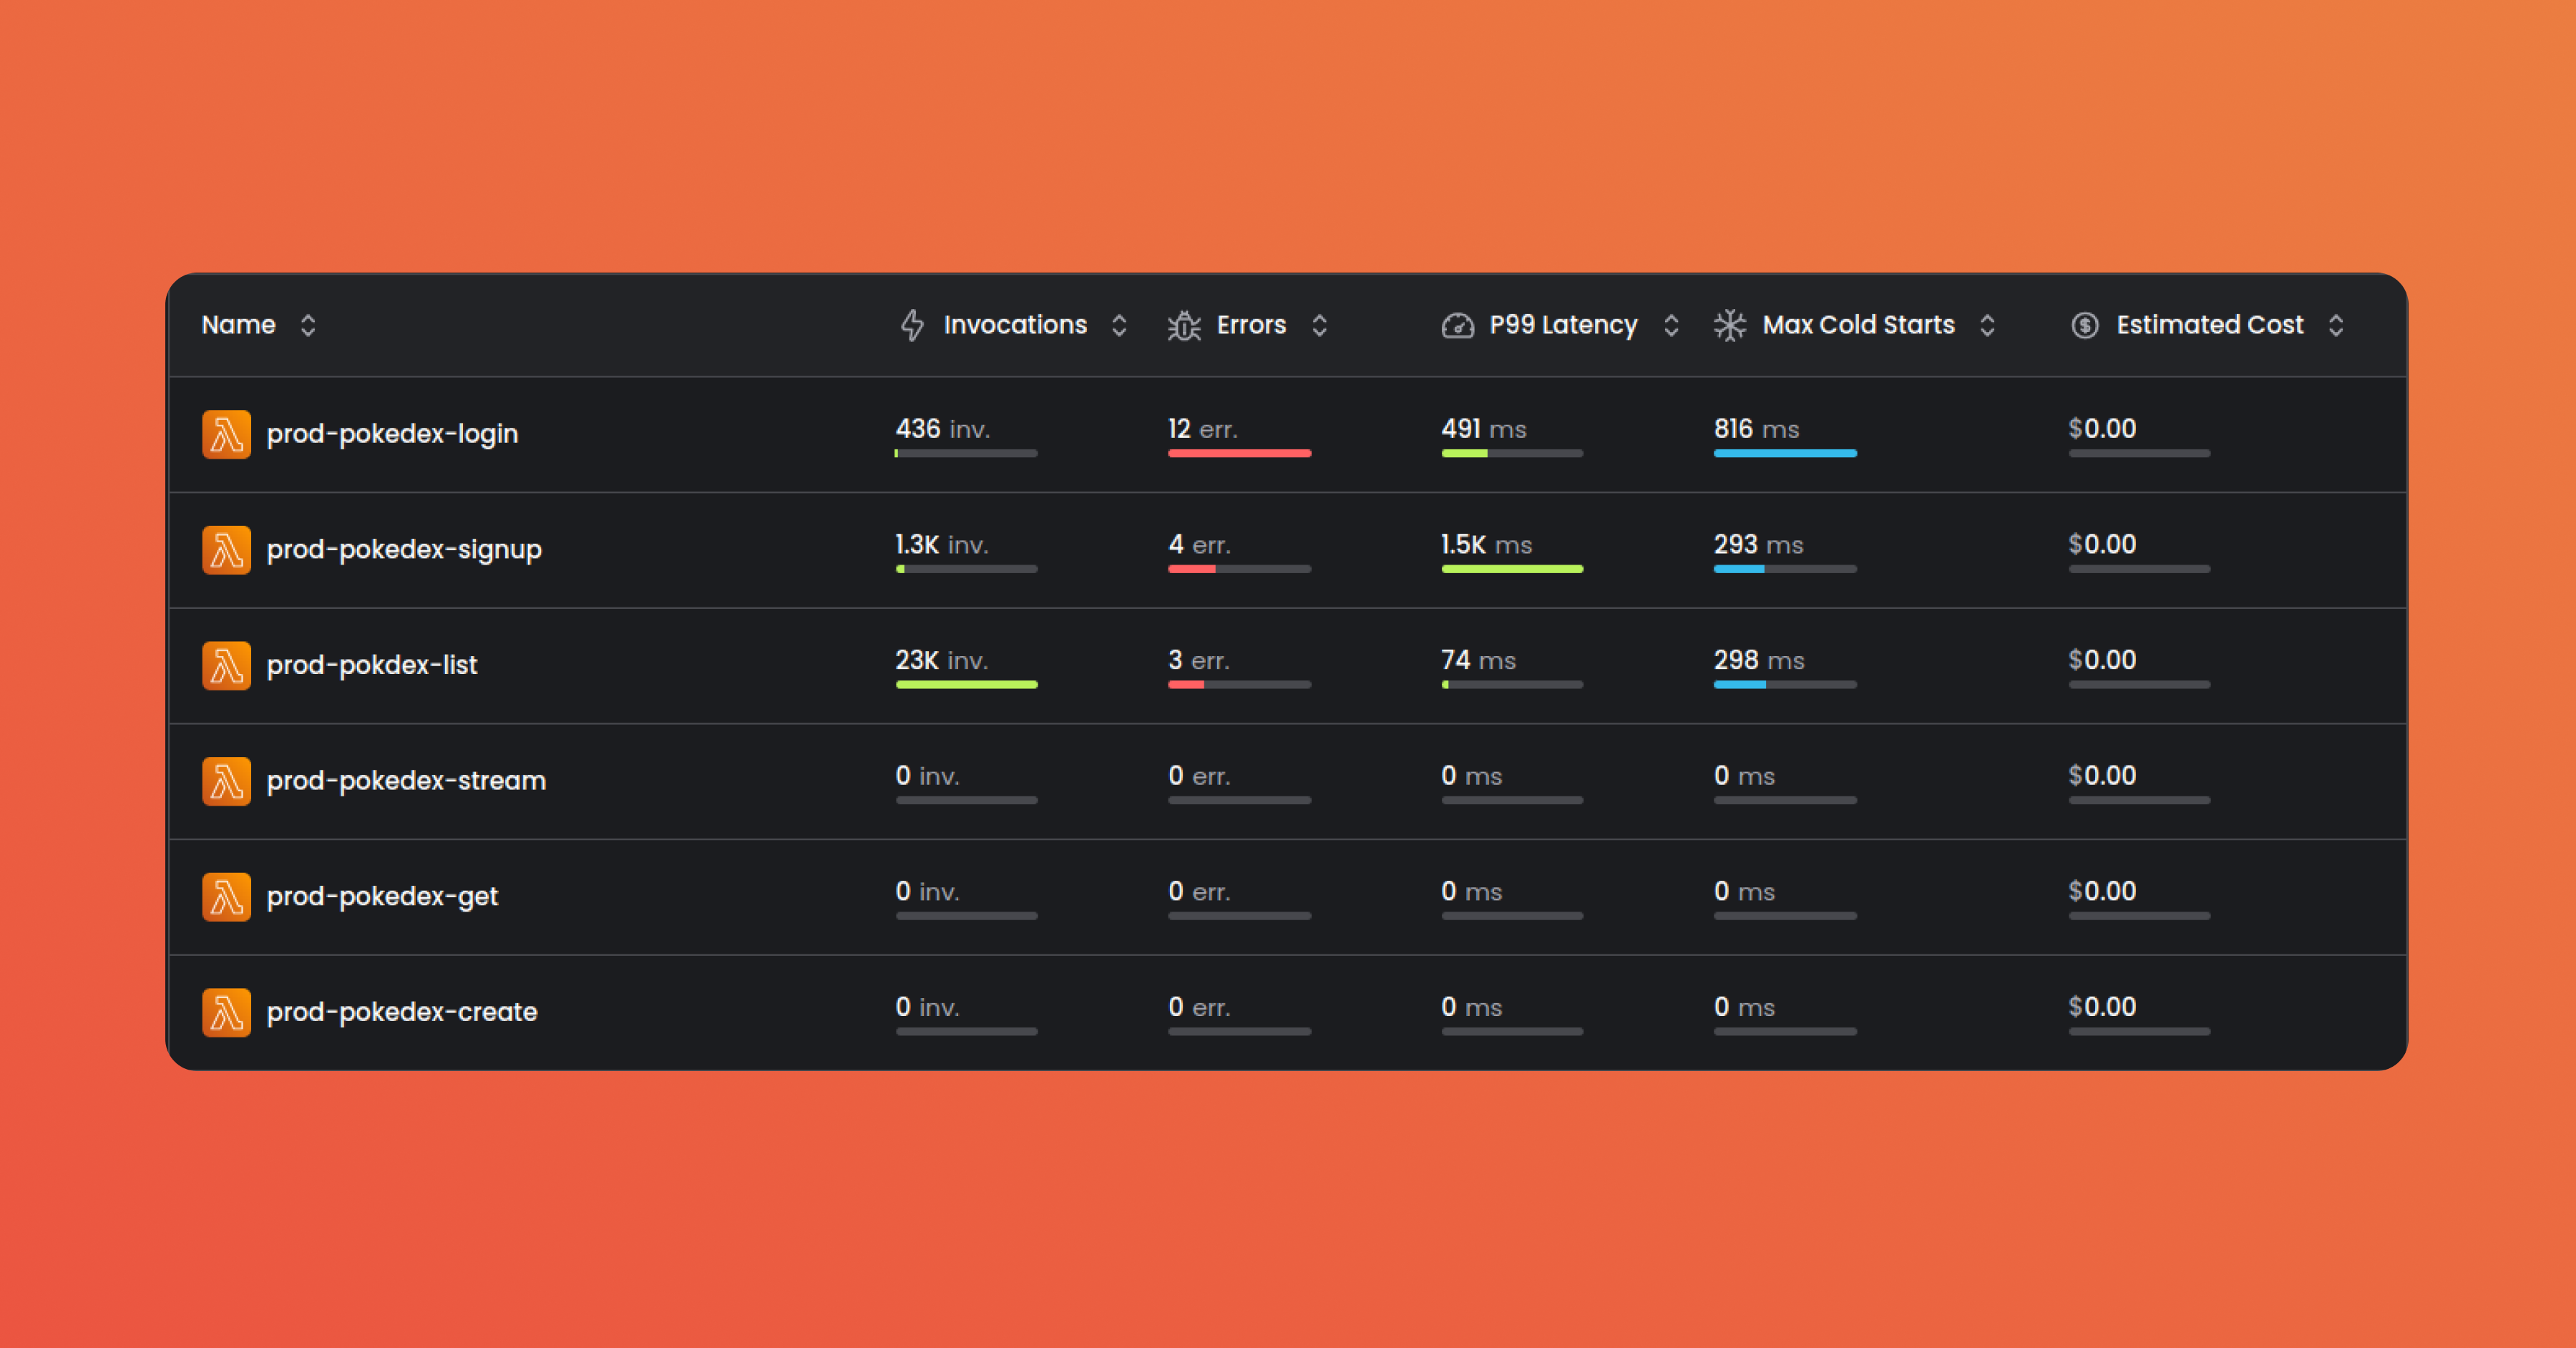
We revamped the inventory table to make it more accessible and readable. Initially, it only displayed function latencies and cold starts but now also includes errors, number of invocations, and most recently, their estimated cost. With this simplified table, you can quickly grasp the performance and cost metrics of your functions at a glance.
Improvements & Fixes
- Improved the performance and reliability of the X-Ray ingestion
- Improved the web console architecture to make it snappier
- Fixed OpenTelemetry tracing for callback-based AWS Lambda functions
- Fixed defect where auto-instrumentation with no API Key would result in failures
Cost Estimates
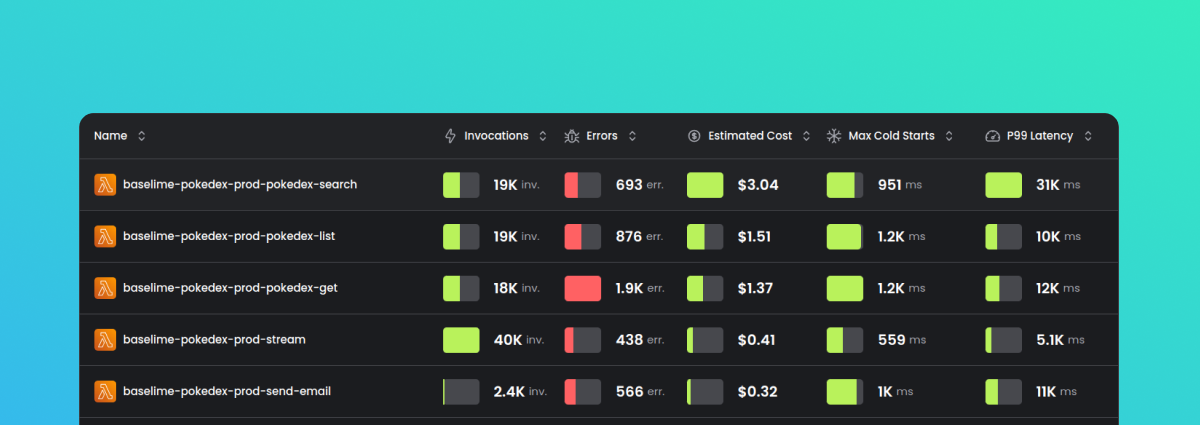
We’re introducing our first step towards FinOps within Baselime - you can now estimate the cost of AWS Lambda function invocations based on their configuration. This enables you to monitor the cost of your functions and allocate costs to specific business units. With the new $baselime.cost variable attached to all your invocations, you can slice and dice the cost of your AWS Lambda functions using the full powers of the Baselime query engine.
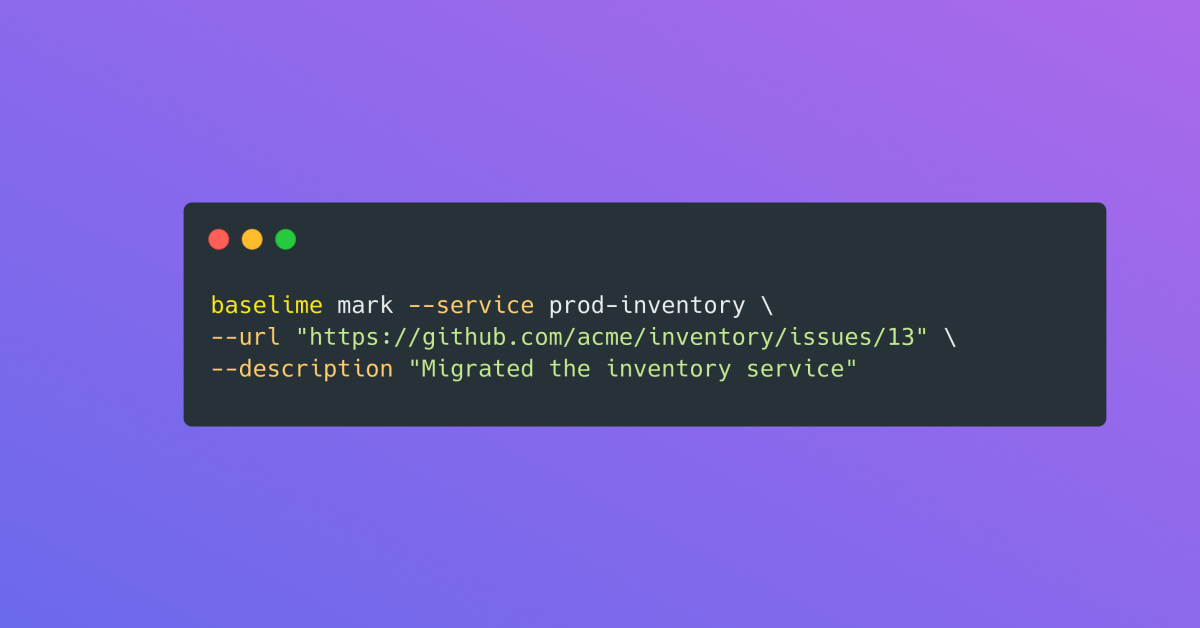
Baselime Mark CLI Command
We’ve introduced the baselime mark command in our CLI. In addition to markers created automatically when deploying serverless stacks, you can now create markers for specific, notable events such as migrations or incidents yourself. The best part? The baselime mark command is seamlessly integrated with all major CI/CD providers so it requires minimal setup.
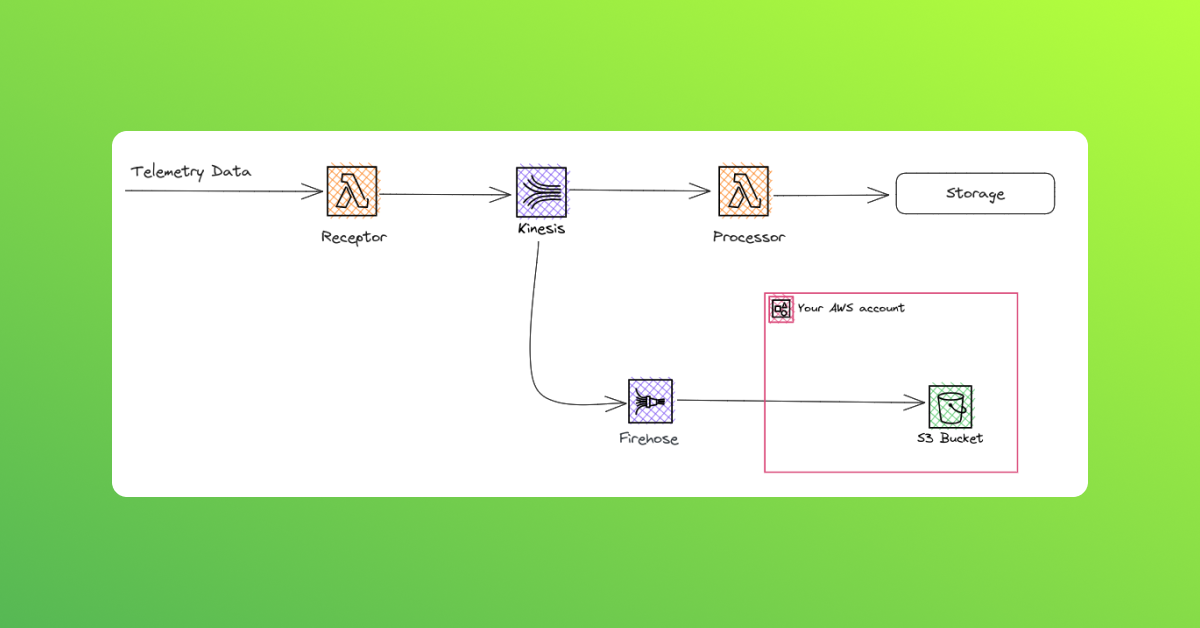
Improved Latency of Receptors
We’re constantly working to enhance your observability experience. We’re excited to announce our significant improvement to the latency of all Baselime telemetry receptors, especially the OpenTelemetry and HTTP events receptors. This means the time necessary to send telemetry data to Baselime has been drastically reduced. How did we do this? By decoupling the process of receiving and processing the data, ensuring faster and more efficient data transmission.
Improvements & Fixes
- Fixed boolean parsing in OpenTelemetry receptor
- Added support for gzip compressed OpenTelemetry in the OTel receptor and the AWS Lambda Extension
- Fixed a bug related to joining a workspace on the Free plan when the number of seats available is exceeded
- Improved the display of markers in the web console
- Added a distinctive color to timed out invocations in the console (purple)
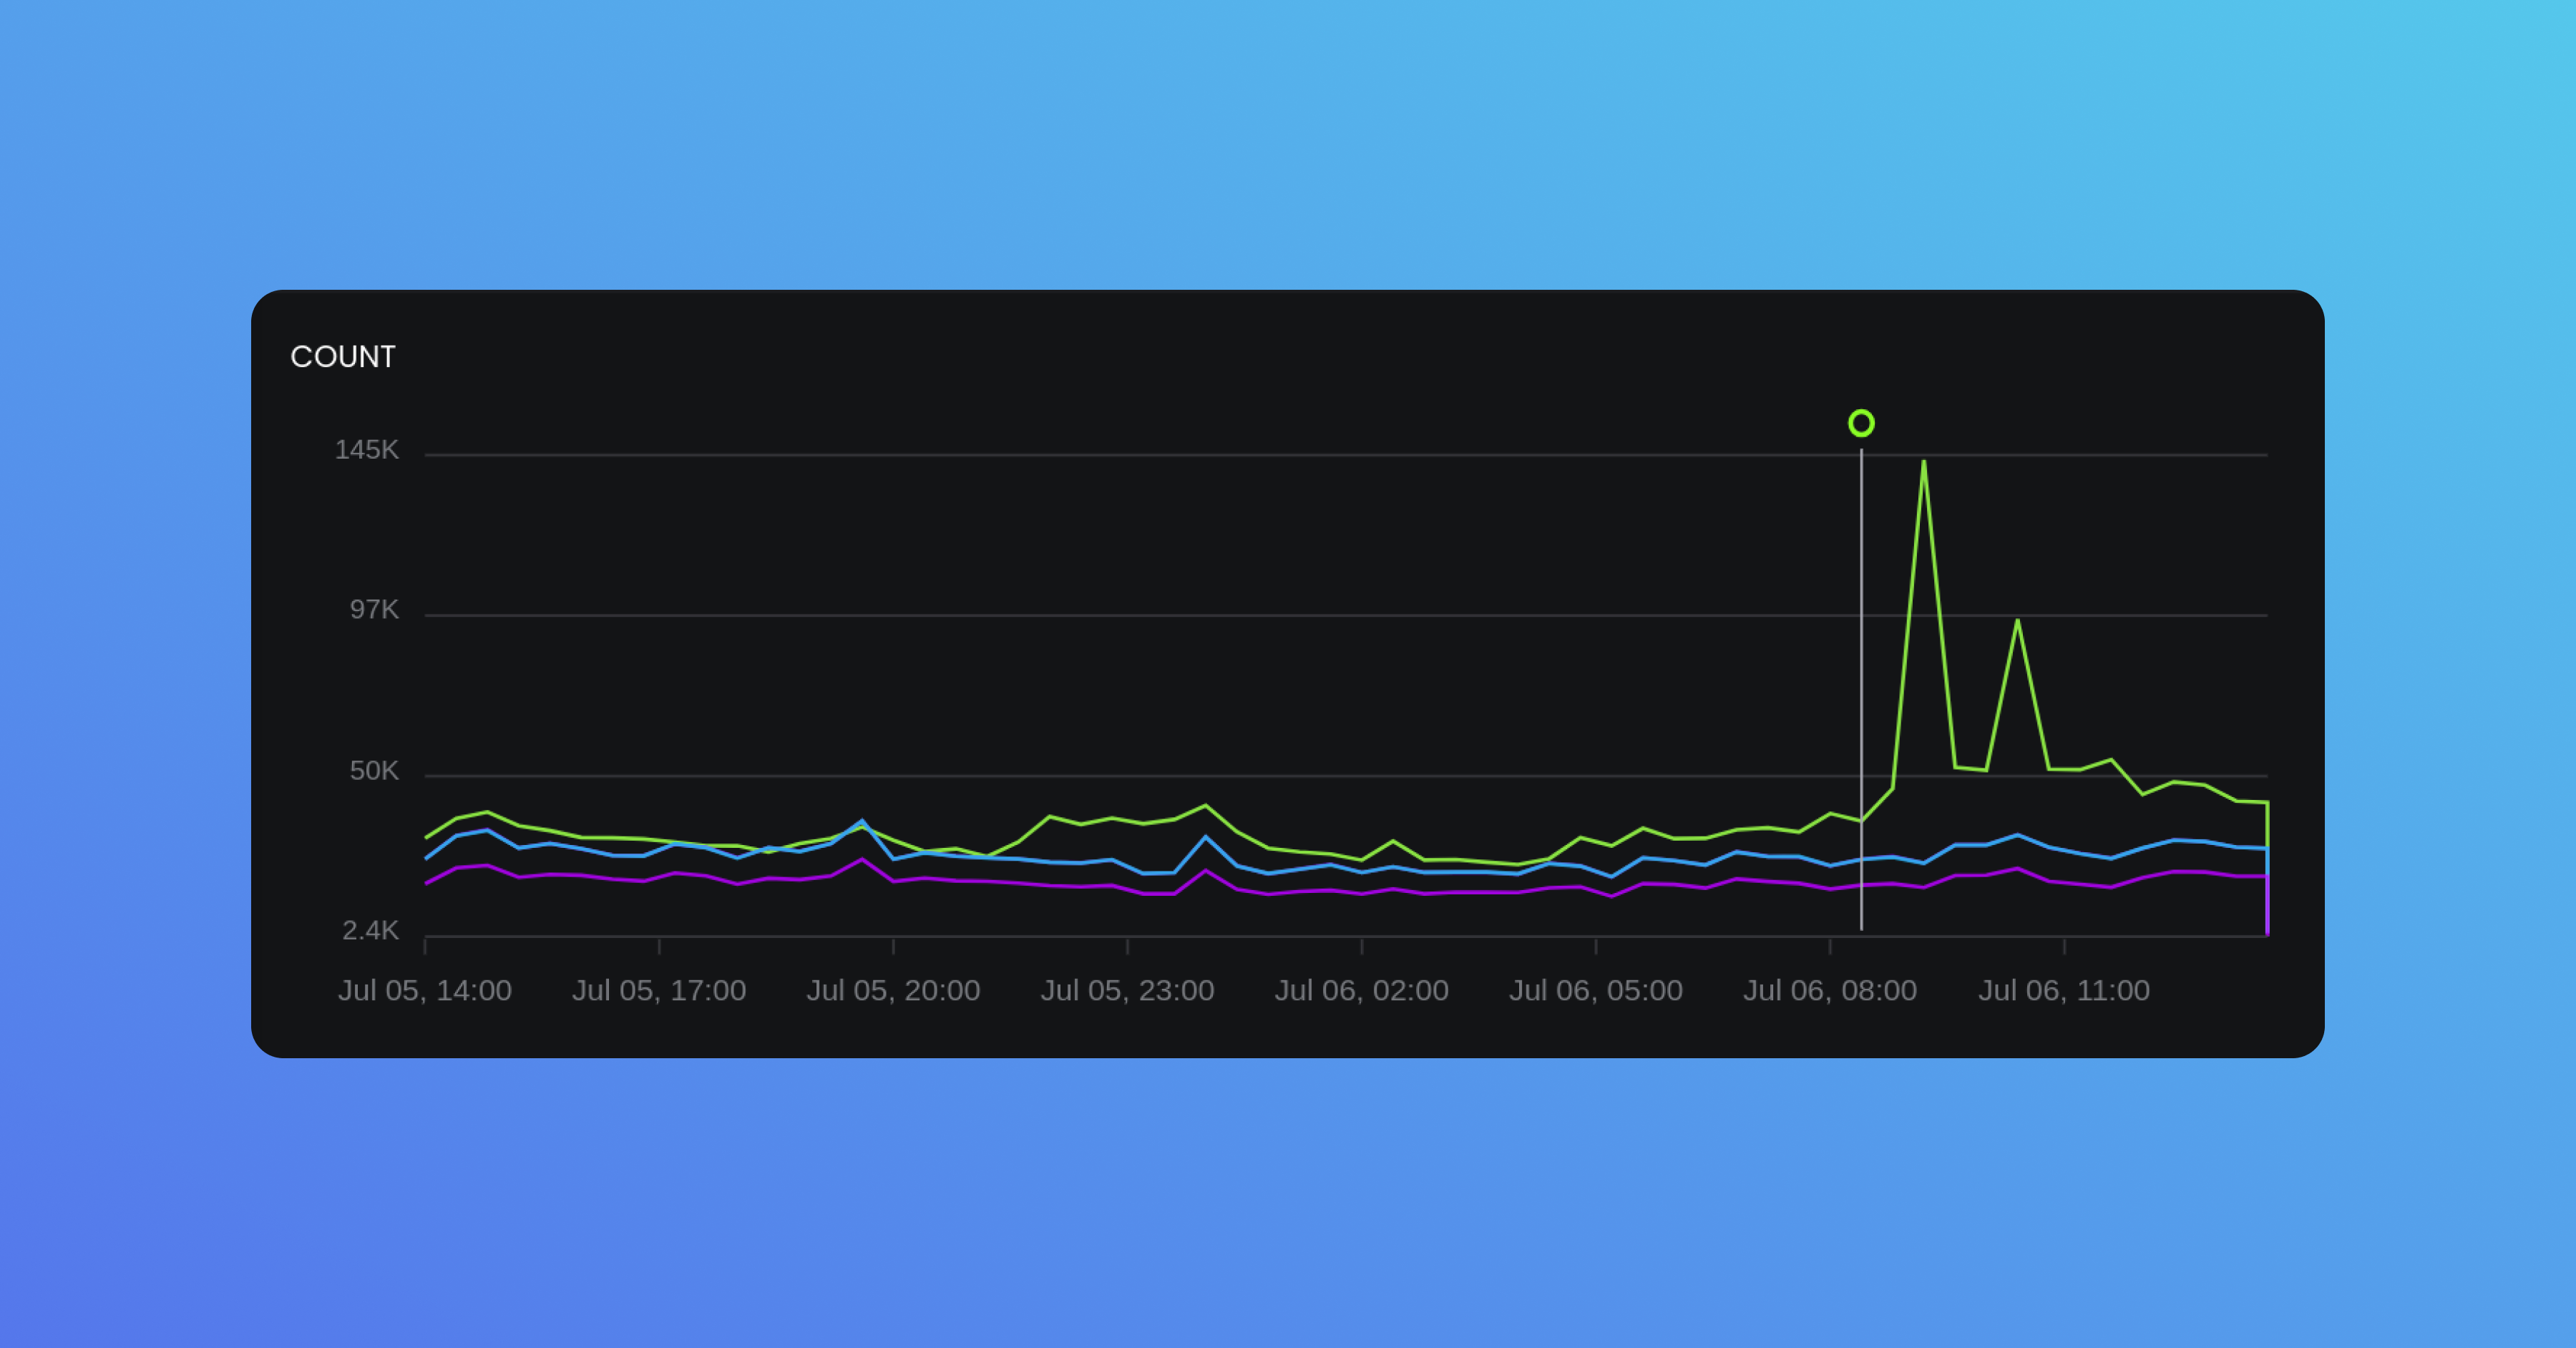
Console Markers
We’re excited to introduce Console Markers, a new feature that lets you identify interesting events in your architecture easily. Markers are automatically generated for deployments of your serverless applications and are now displayed as overlays on your charts. This enables you to pinpoint significant events within your system quickly.
Improvements & Fixes
- Added support for gzip compressed OpenTelemetry traces
- Fixed navigation buttons that would intermittently freeze the console
- Improved reliability for polling X-Ray traces
- Fixed a timeout bug that would happen between the Baselime Node.js layer and the Baselime extension
- Fixed
disableStackFilterbehaviour in Baselime CDK