Automatic OpenTelemetry Tracing
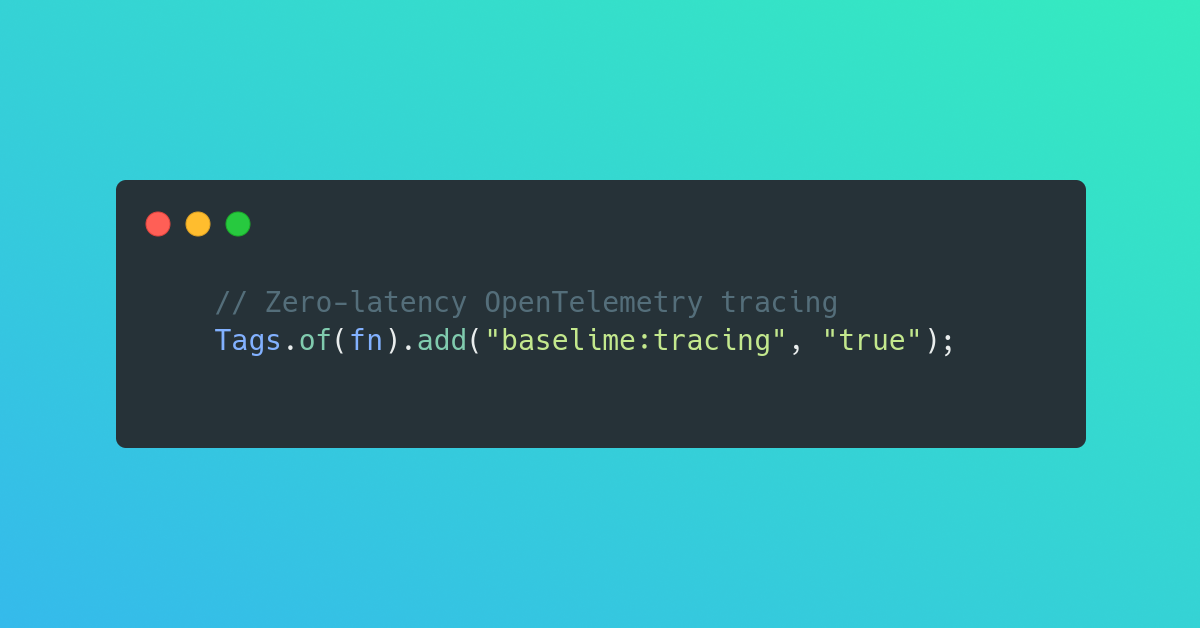
Baselime now enables you to automatically instrument your Node.js AWS Lambda functions with OTel. Simply add the baselime:tracing tag to your Lambda functions, we’ll take care of the rest. You can effortlessly get industry-standard distributed tracing, and improve the performance and behaviour of your Lambda functions without any manual configuration.
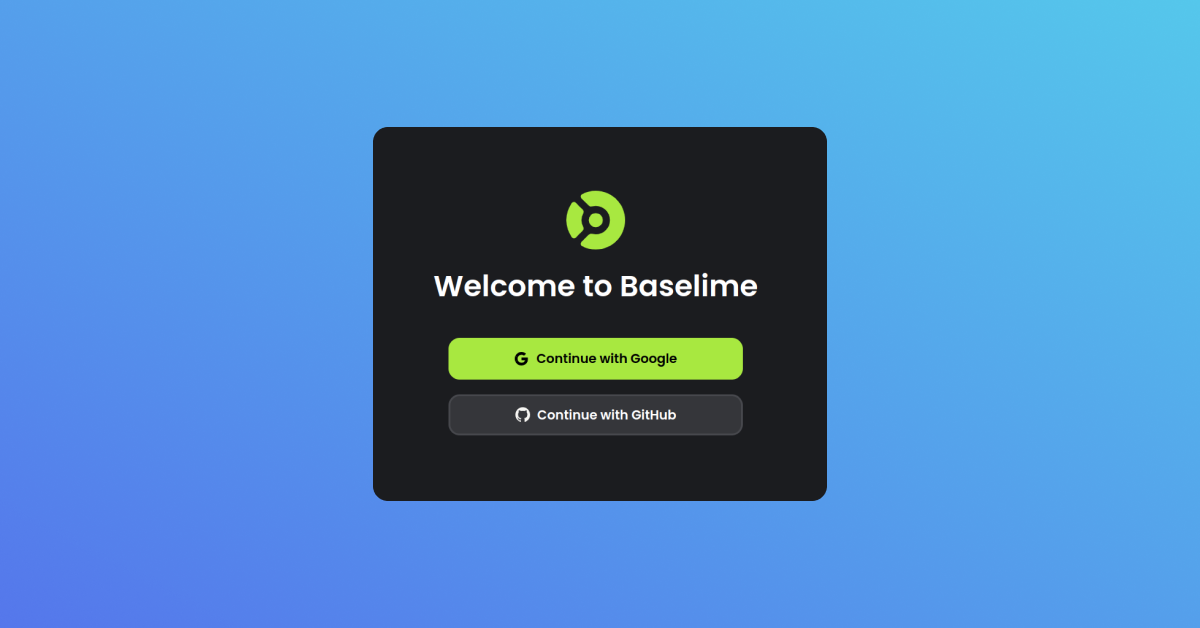
GitHub Signup
Are we really a developer tool without GitHub signup? You can now create a Baselime account using your GitHub credentials.
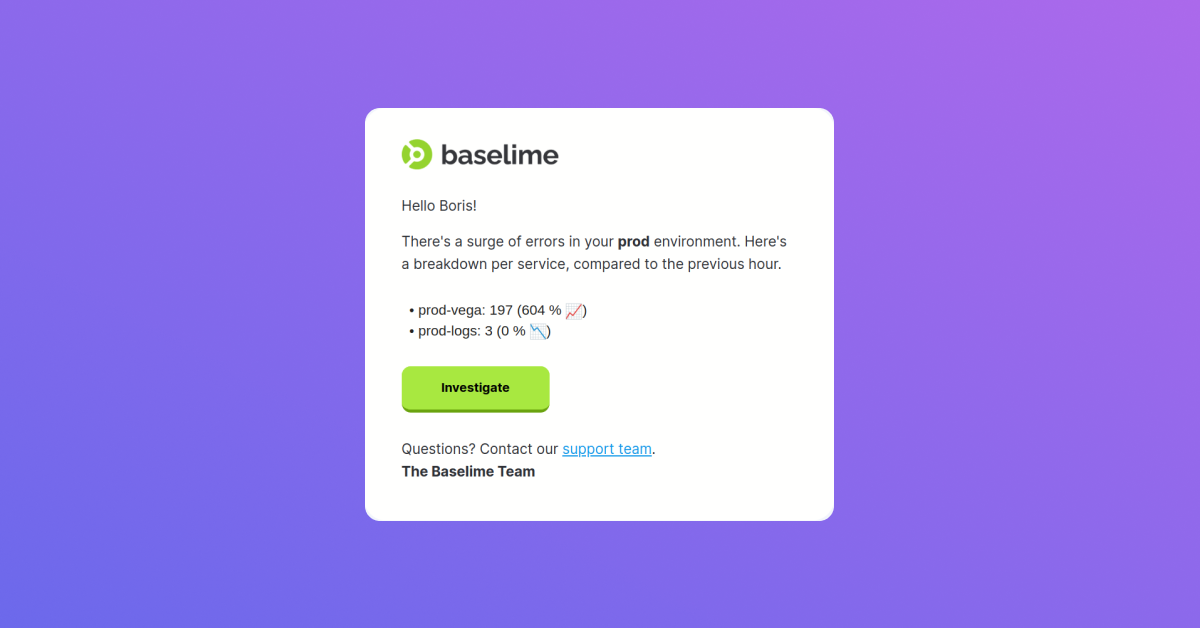
Automated Error Surge Notification
It’s critical for any serverless team to be alerted when the number of errors in their architecture suddenly and drastically increases.
It’s why we introduced automated email notifications for error surges. This email has error surges conveniently grouped by services and provides a direct link to the root cause. In the coming weeks, we’ll expand this feature to allow fine-tuning of the sensitivity such that it matches your architecture specifically.
Improvements & Fixes
- Added support for
INCREASES_BY_MORE_THANandDECREASES_BY_MORE_THANalert thresholds - Fixed missing event when the incoming event is a string with non-ASCII characters
- Fixed parsing of key-value pair log strings where the string contained a URL
- Added ability to delete a user account
- Added full-screen charts to the console
- Improved developer experience around the Baselime CDK
- Clarified Slack bot messaging for when a user tries to connect their account multiple times
- Performance improvements on the X-Ray traces processor
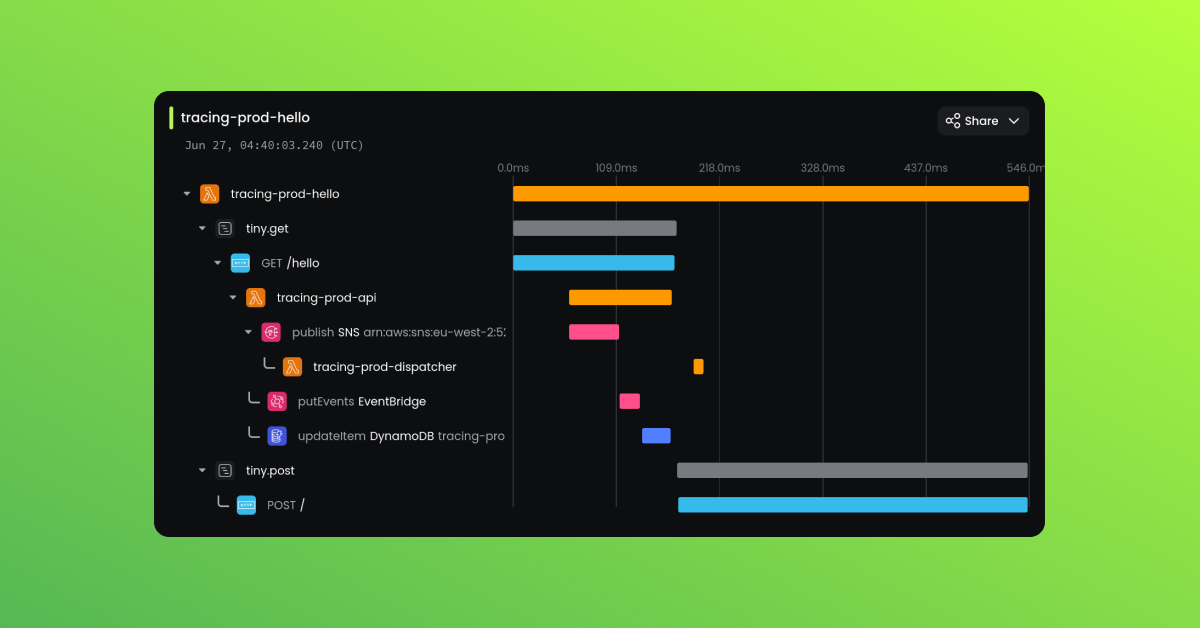
- Improved the trace waterfall view, with more service icons and better colors
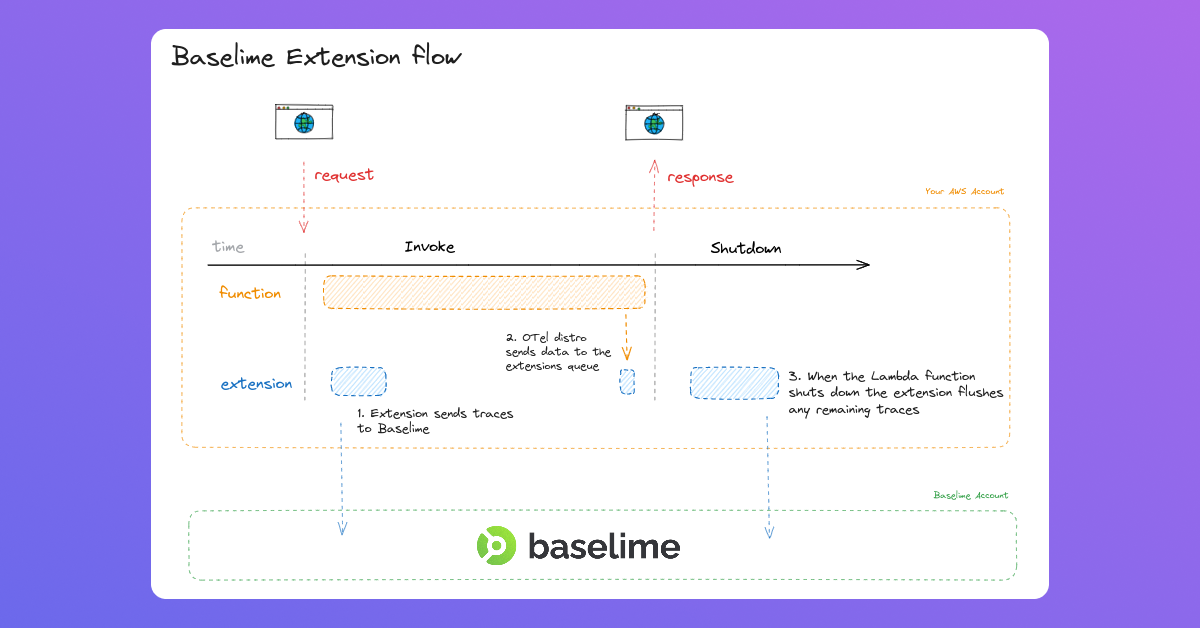
Zero-latency OpenTelemetry Tracing
We’re excited to announce that you can now trace your Lambda functions with OpenTelemetry without impacting performance. Our AWS Lambda layer and Lambda extension make it possible to achieve zero-latency tracing. This means you can get detailed insights into the performance of your serverless environment without any negative impact on your application’s performance.
OpenTelemetry Logging
We made logging even better with our OpenTelemetry Logging library. Rather than logging, you can now enrich your OTel spans with rich context events. This library is easy to use and feels just like a logger. This enables you to get more detailed insights into your application’s behaviour and performance.
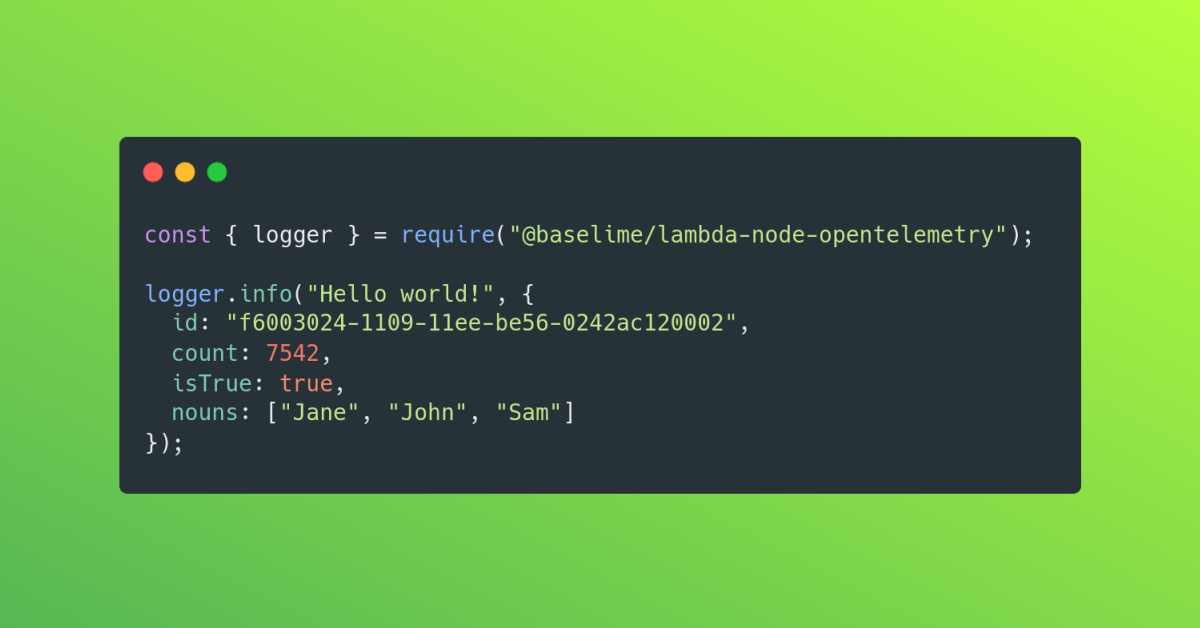
The above code snippet will add a span event to your traces. This enables you and your team to use OpenTelemetry without drastically changing your processes.
Optimised Navigation
We simplified the navigation in the Baselime console some more so finding the info you need is even easier. We’re always looking for ways to improve the user experience, and this update is just one of the ways we’re doing that.
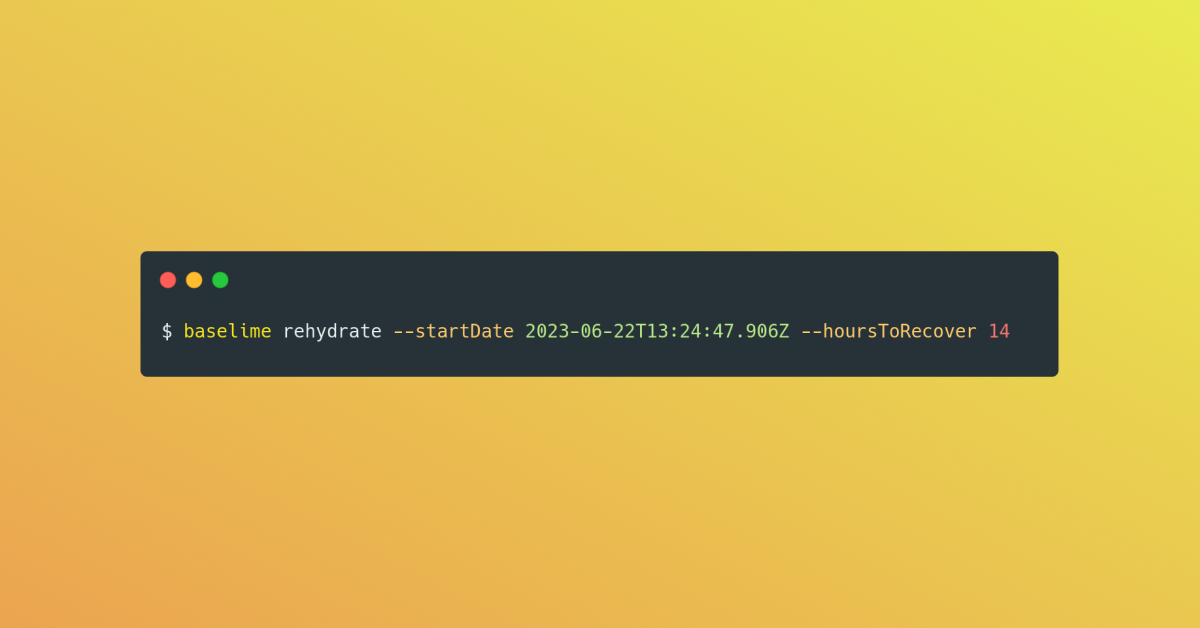
Rehydrate CLI Command
We made it easy to rehydrate data past your retention period using the Baselime CLI. Retrieve otherwise lost data with just a few simple commands. This feature is handy if you need to analyze data for compliance or auditing purposes.
Improvements & Fixes
- Significant performance and reliability improvements in our ingestion pipelines
- Improved the reliability of the alert charts in Slack
- Fixed the automatic creation of markers for maintenance stacks
- Fixed defect when the same chart is added to a dashboard multiple times
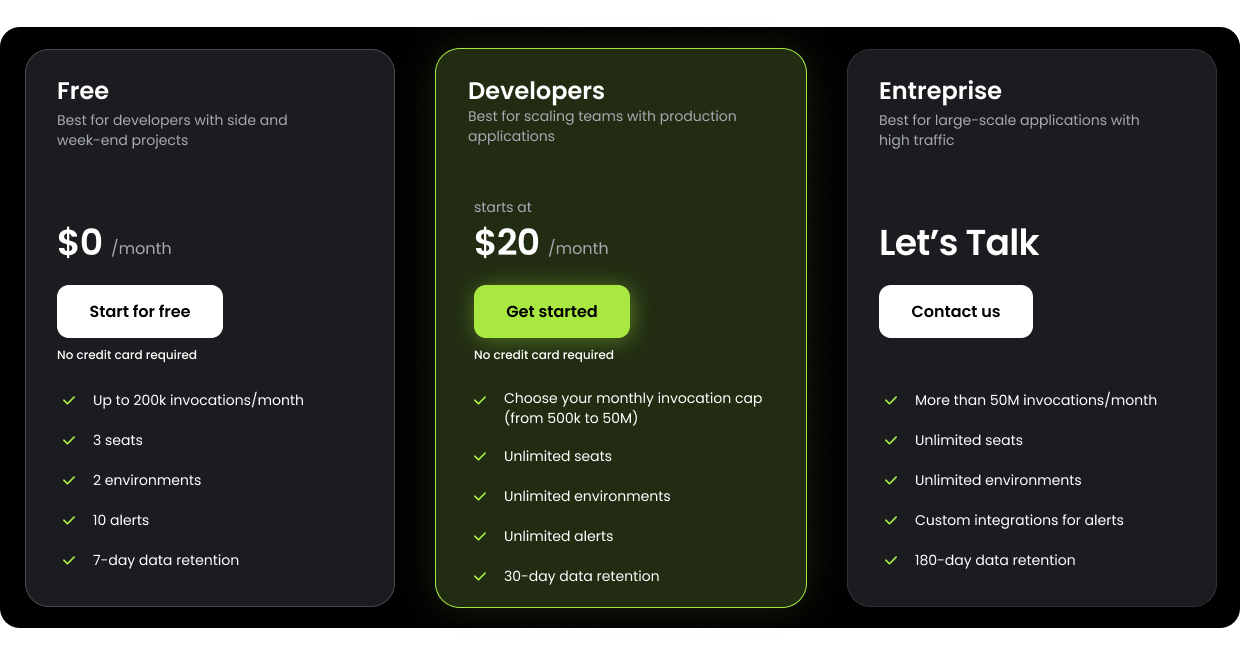
New Pricing - Invocations
Predictability - It’s what excites us about our new pricing plan. It’s based on the number of invocations, which is computed by counting the number of unique request IDs or trace IDs in your telemetry data. Maintaining usage-based pricing gives you more predictability in your costs while giving you the ability to scale down to zero for small workloads. We hope this change makes it easier for you to budget and plan for your observability needs.
Rehydration API
Sometimes it’s necessary to go back in time and dig through historical data to better understand your system today. The new rehydration API enables you to re-ingest expired logs, metrics and traces to get the insights you may have missed.
OpenTelemetry Distribution for Node.js
Our Otel distro now supports SST v2 and ES modules. We replaced the @opentelemetry/instrumentation-aws-lambda package with a custom manual plugin that you wrap your handlers with. This enables you to work with any packaging format.
Improvements & Fixes
- We now also distribute our Otel distro as a layer
- Improved navigation in the console
- Improved reliability of charts
- Added button to easily copy Observability as Code configs in the console
- Fixed defect where logs missing request ID would have request ID taken from the event body