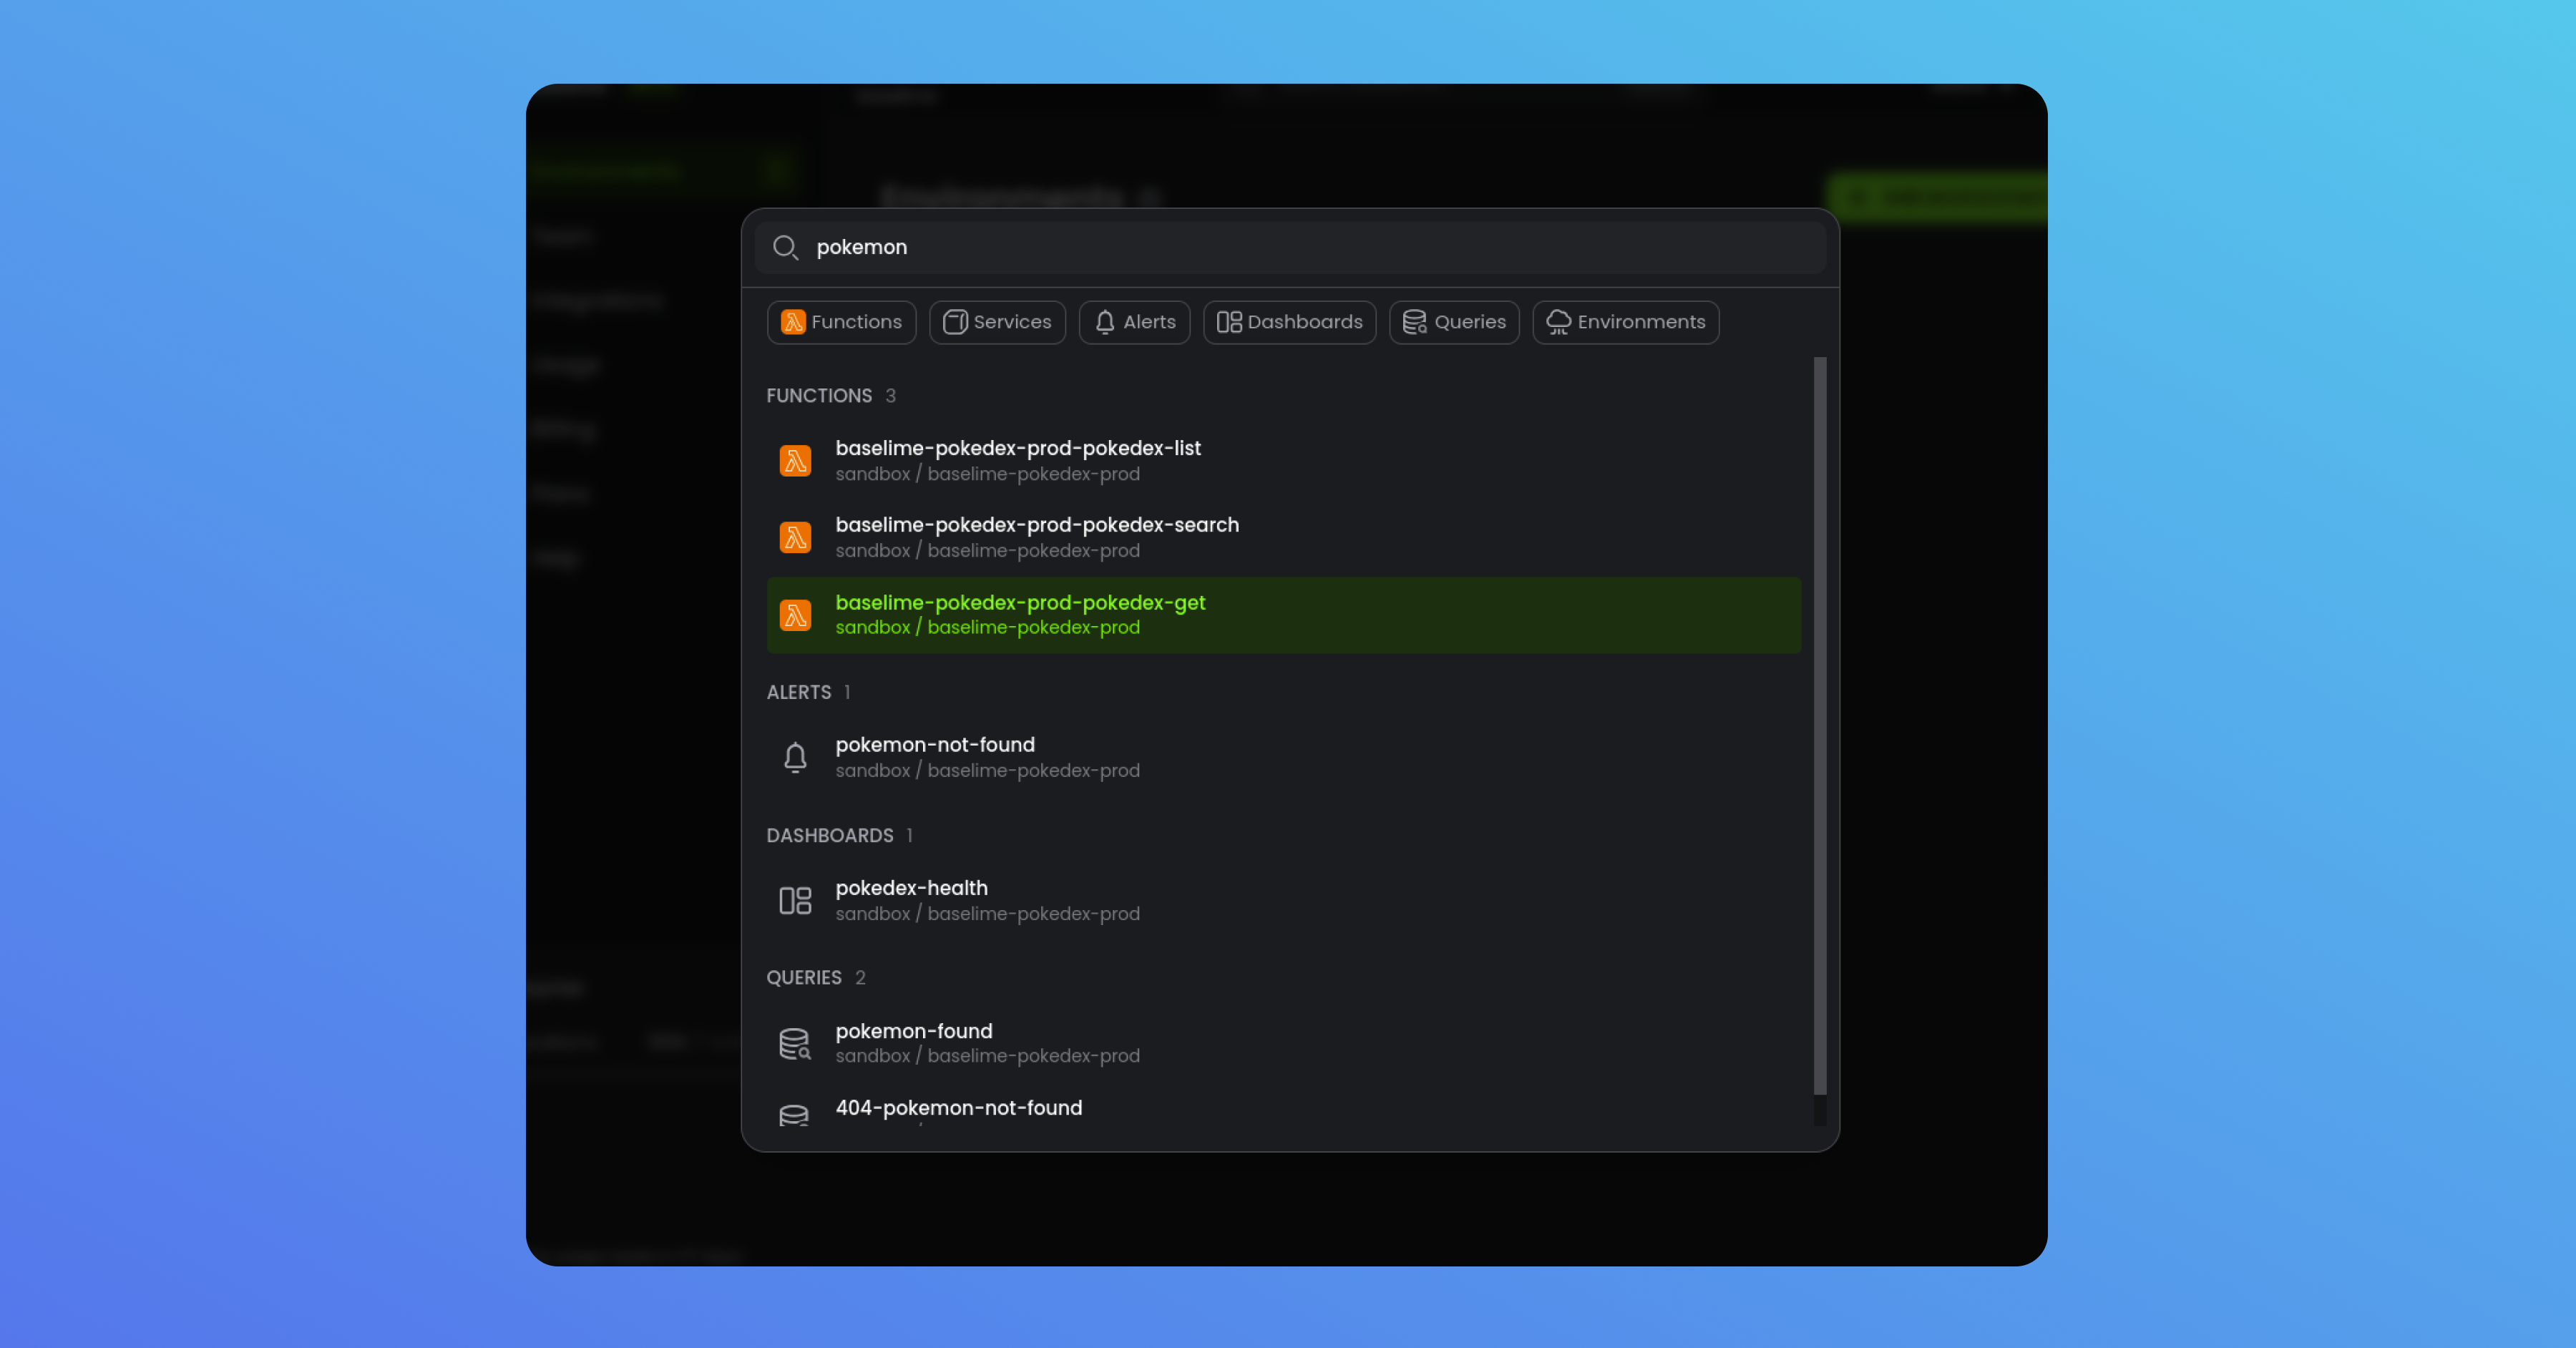
Command Bar for Observability
We’re thrilled to introduce the Command Bar, your new navigation companion for observability. Press a few buttons and jump from viewing a dashboard to exploring the traces of a function in a different AWS region. Goodbye tedious clicks, hello lightning-fast observability!
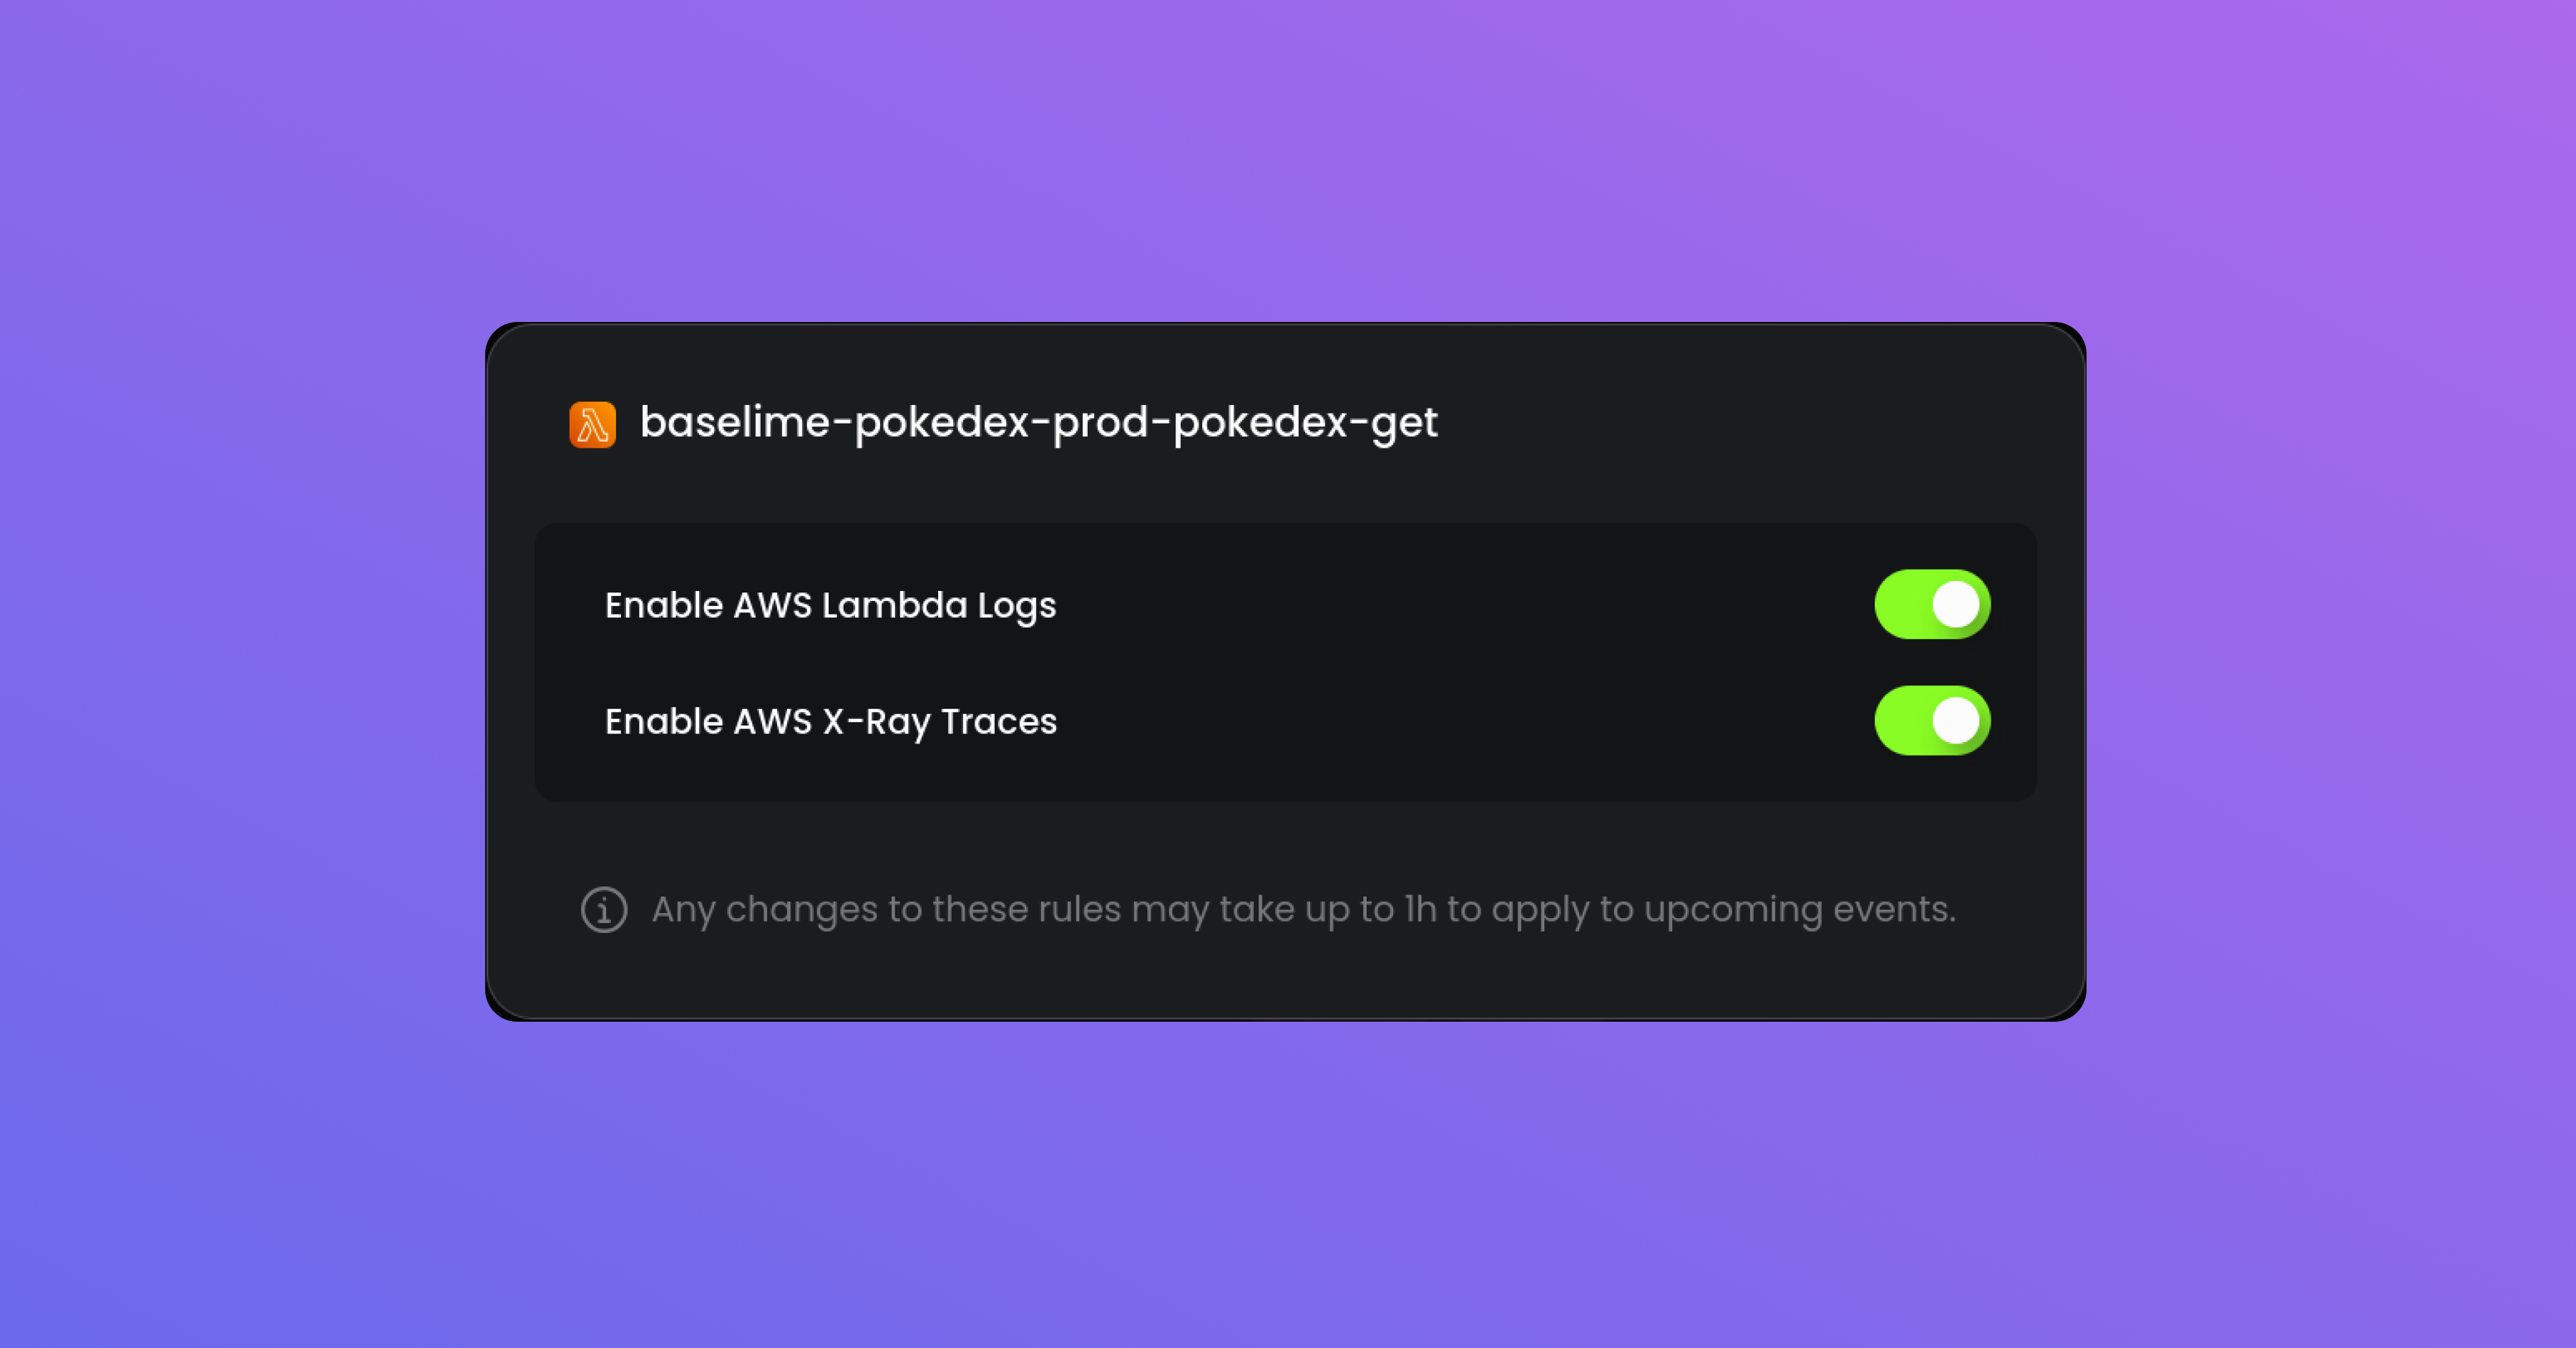
Data Ingestion Control for Individual AWS Lambda Functions
You asked, so we delivered. You now have the power to control the data ingestion for individual AWS Lambda functions. Tailor data flows to your specific needs, enabling you to fine-tune your observability and focus on what matters most to you.
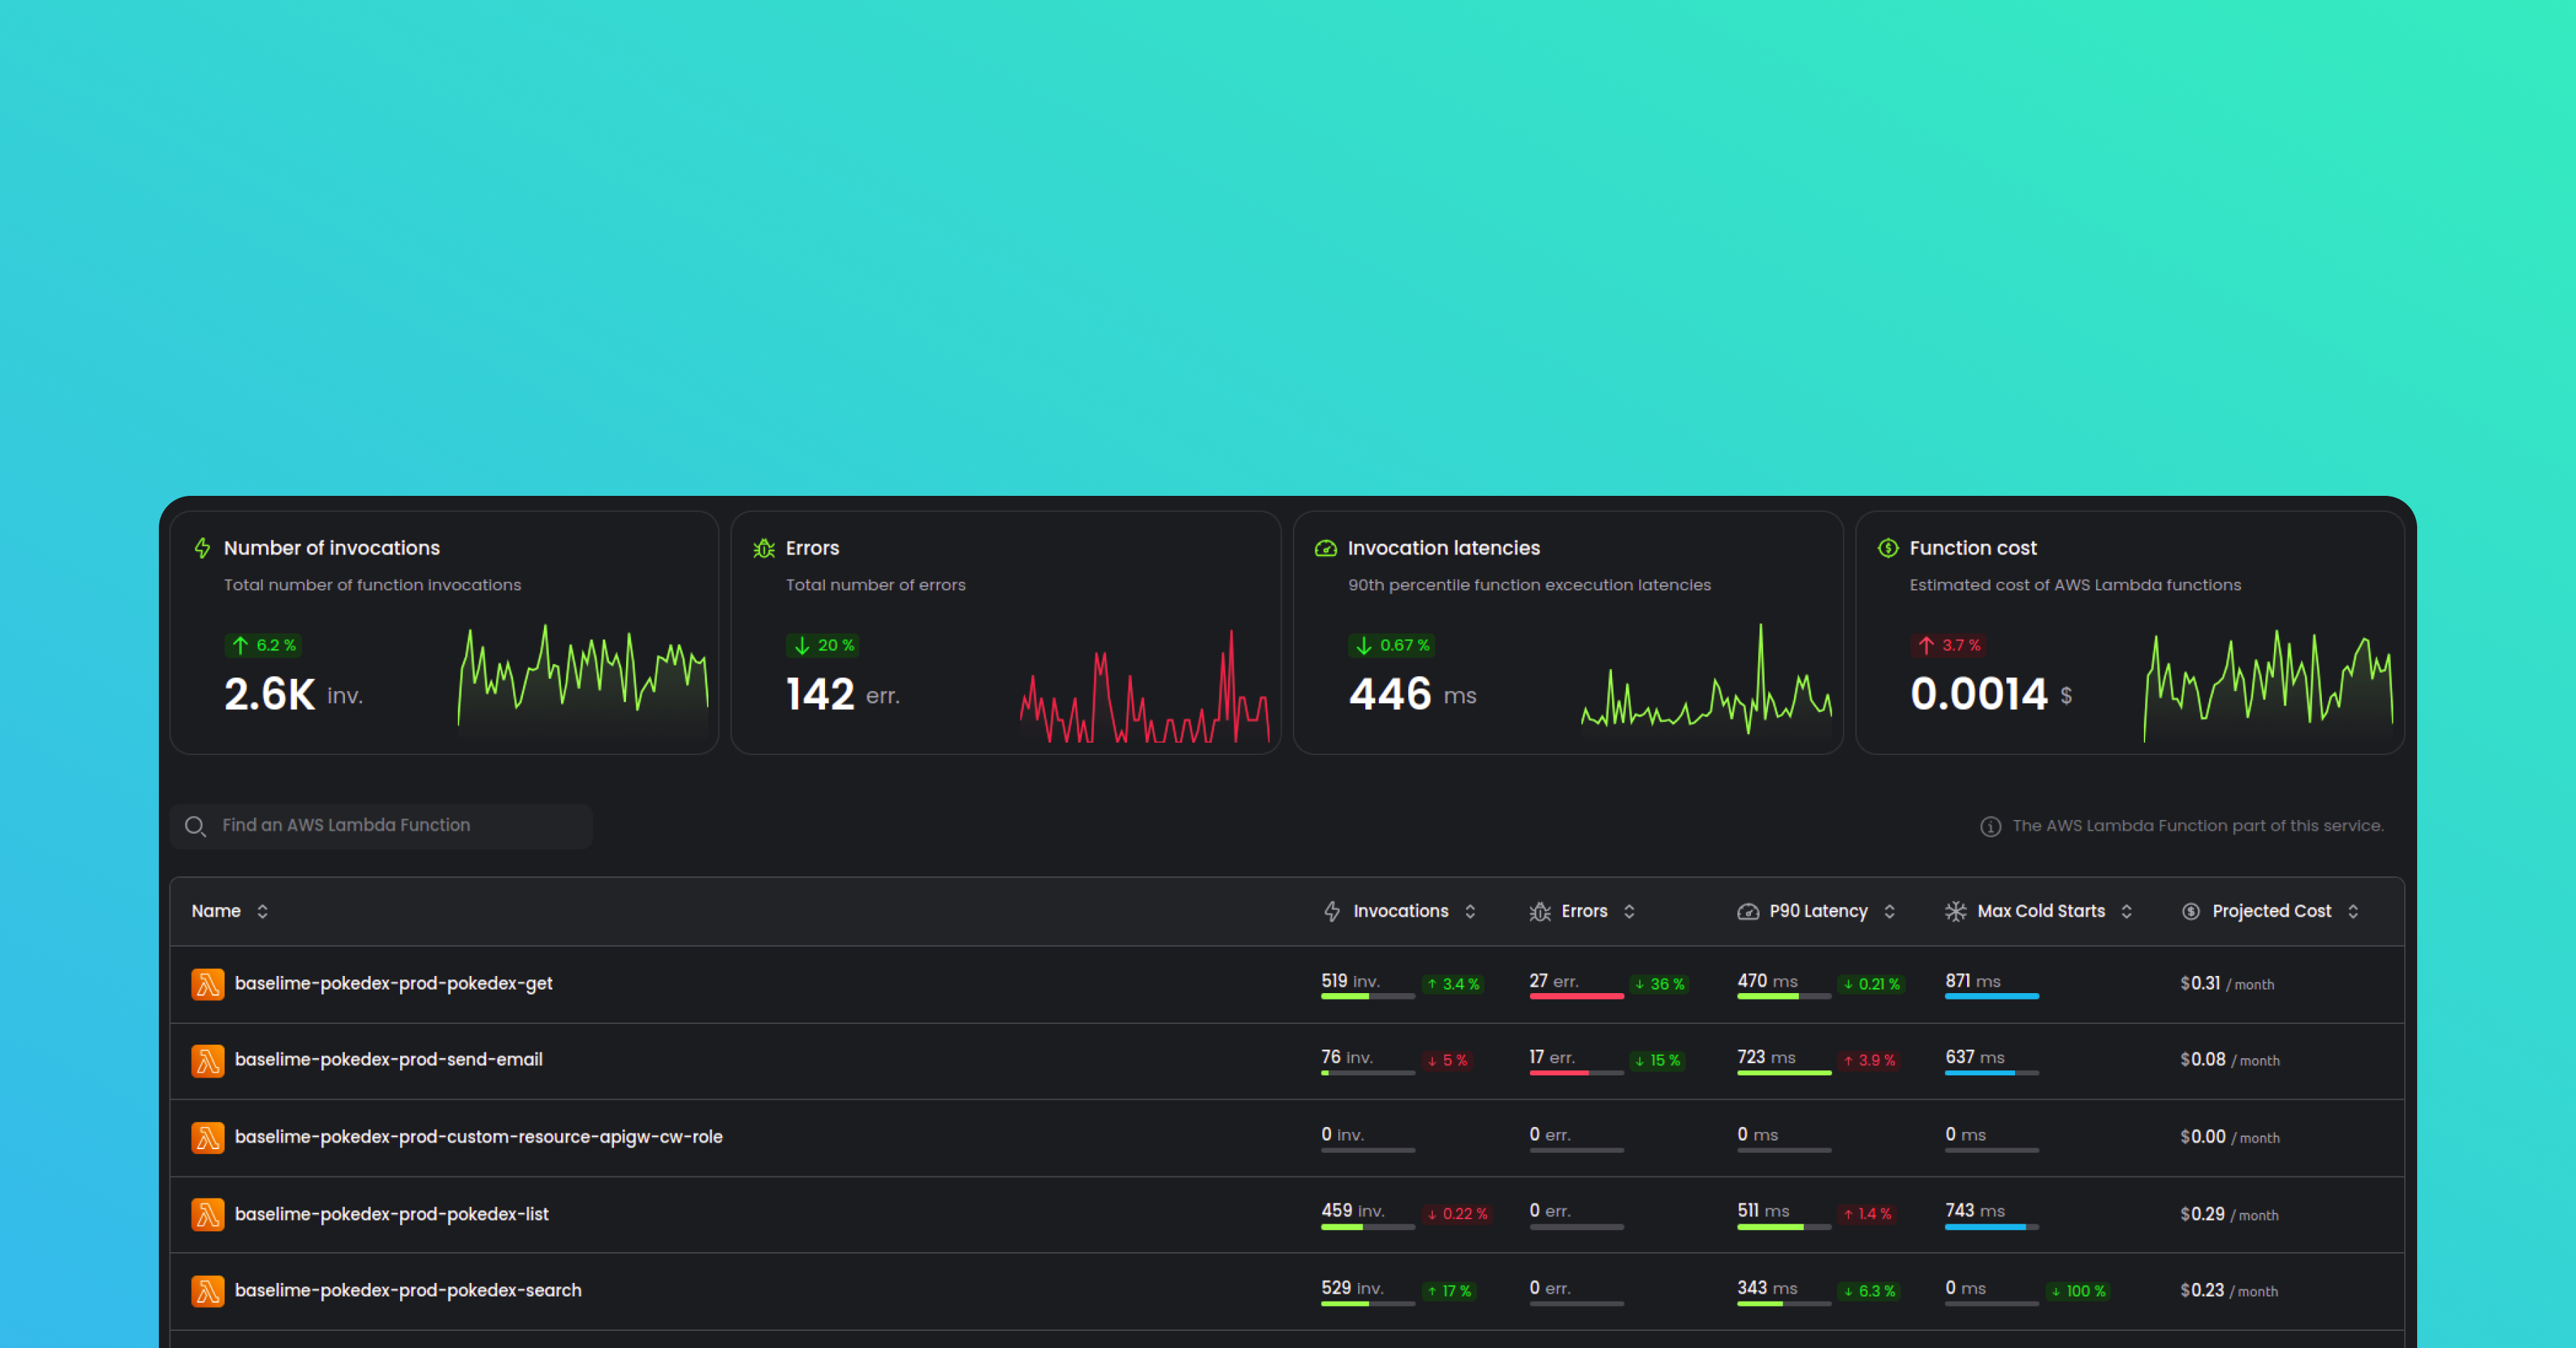
Cost Projections for AWS Lambda Functions
Curious about the projected cost of your AWS Lambda functions? Look no further, the inventory table now shows the projected cost of each function individually - this assumes the number of invocations and durations remain constant for the rest of the month. Stay on top of your budget and avoid surprises, particularly when you make changes.
Percentage Changes for Metrics
Metrics matter, and now you can track how they fluctuate. Both the inventory table and the summary charts provide the current value of metrics, such as latencies and number of errors, along with the % change from the previous timeframe. Stay informed and spot trends at a glance.
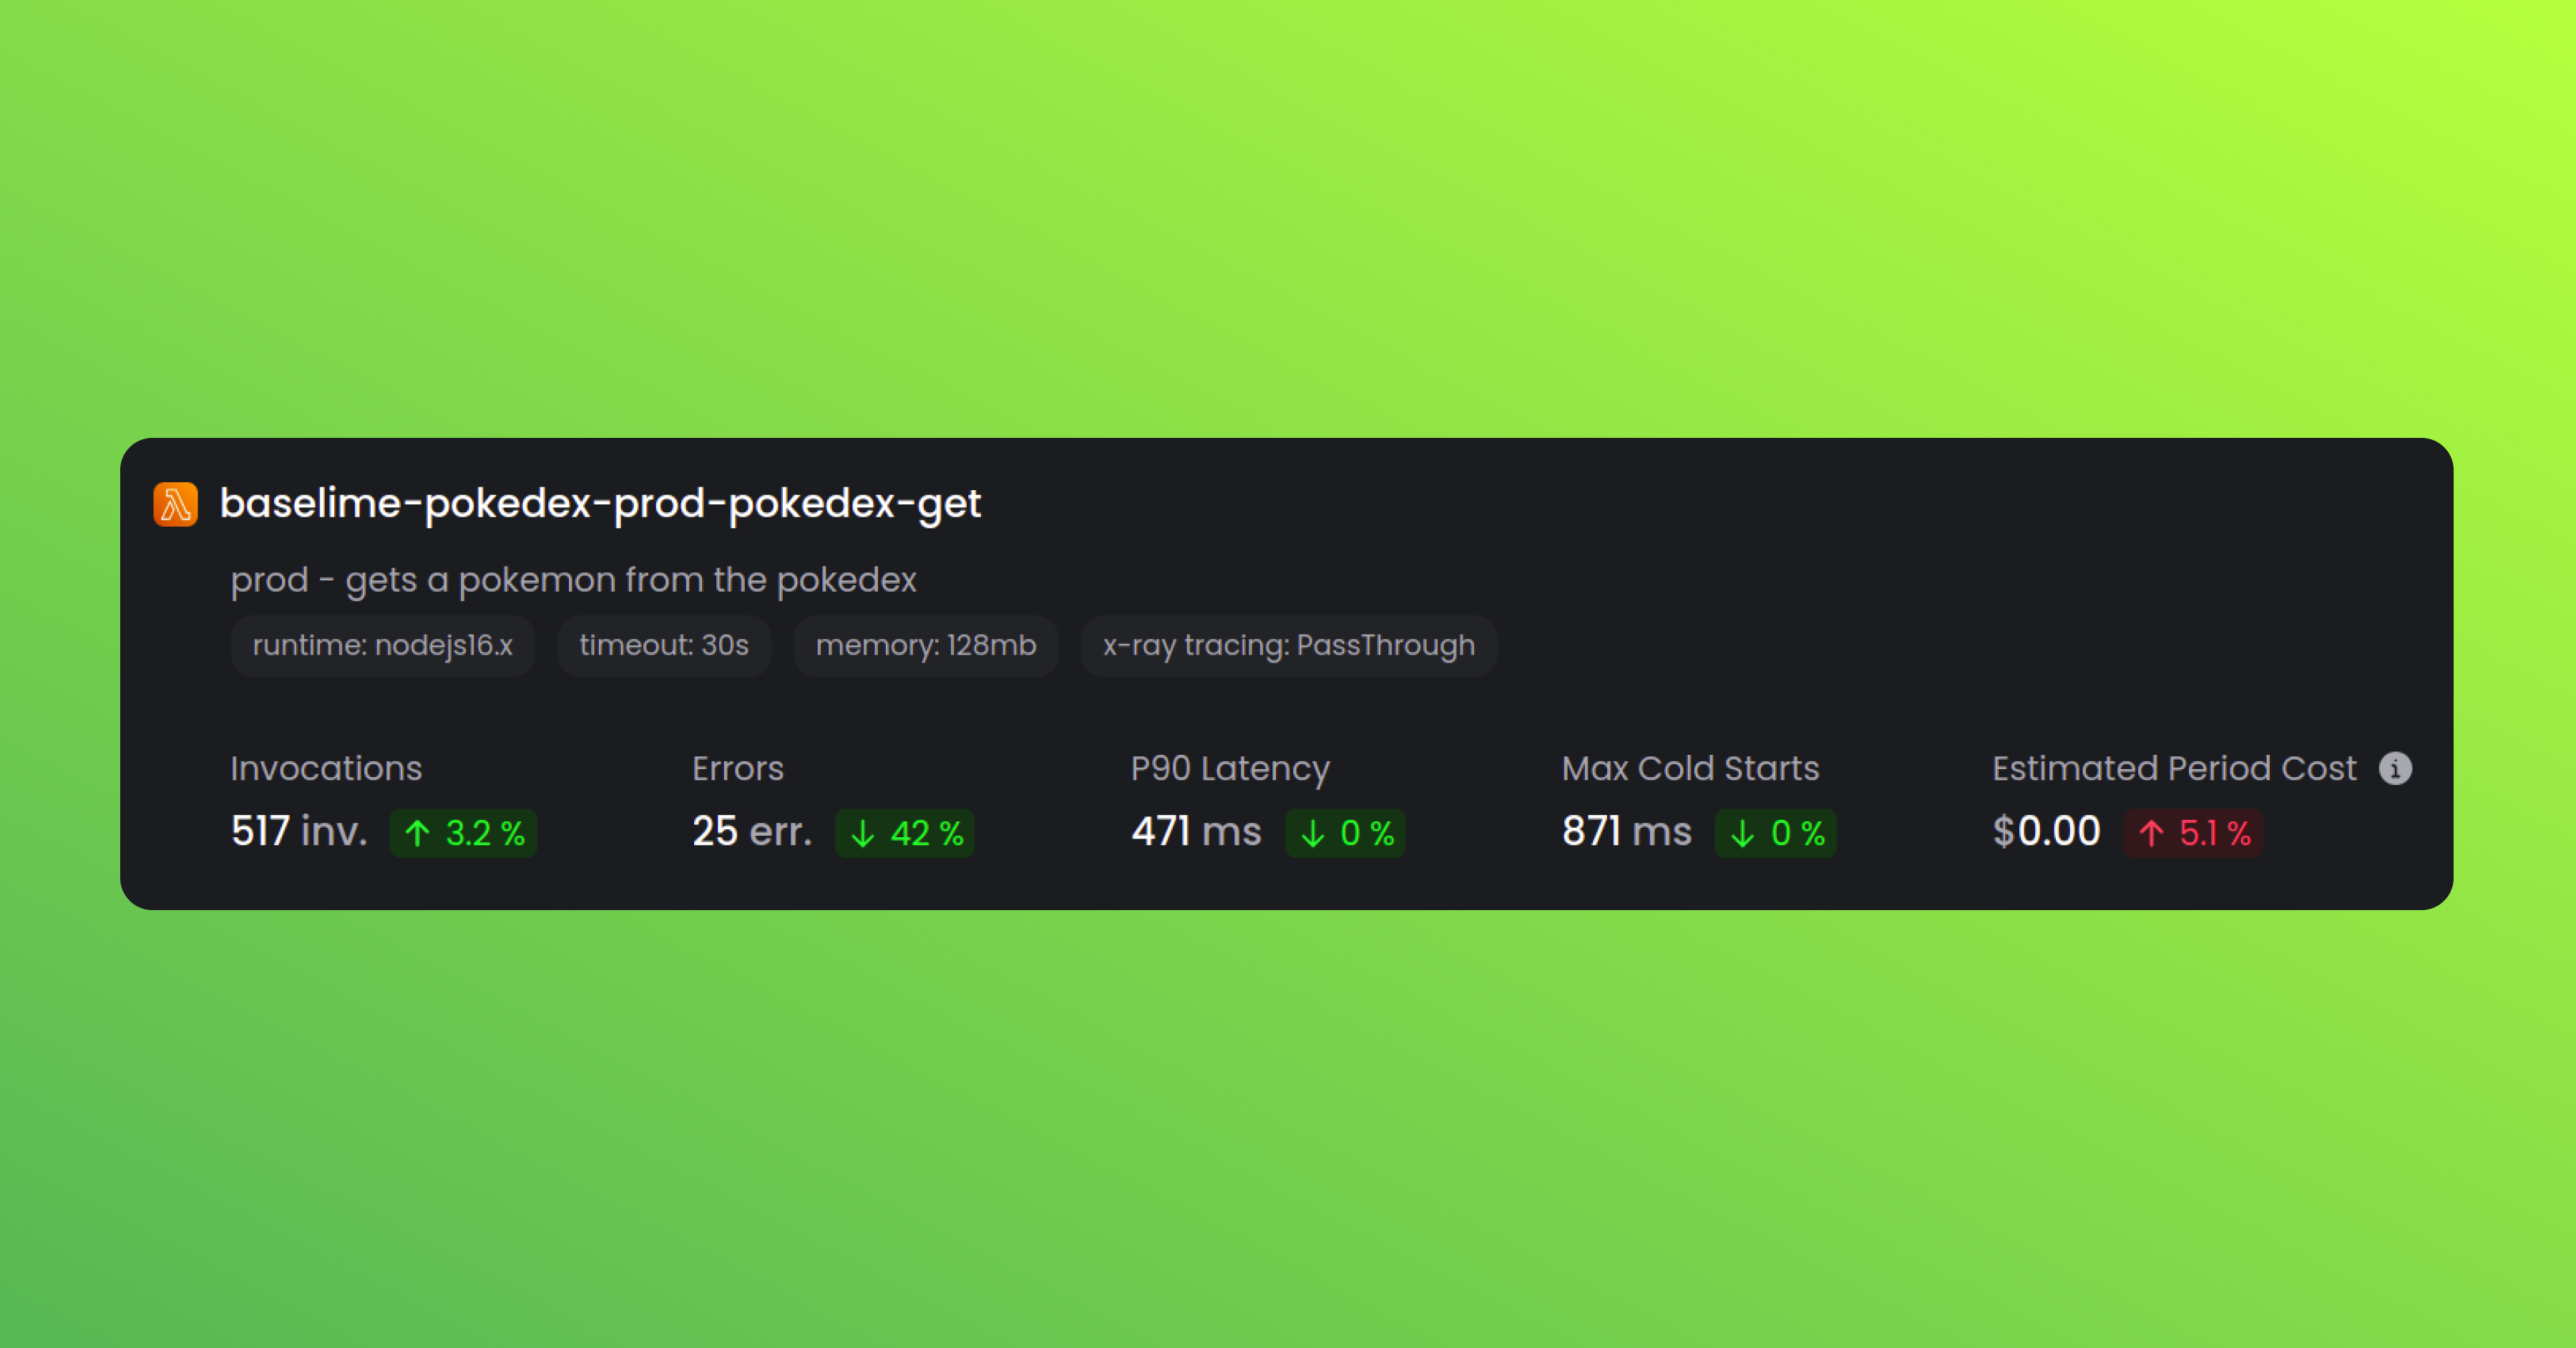
Function Level Stats
Dig deeper into your functions with our new function screen. Gain valuable insights into the number of invocations, errors, and other important stats directly from the function view. Uncover hidden patterns and optimize your code for peak performance.
Improvements & Fixes
- Changed the percentile computations to return the exact value instead of close approximations
- Further improved performance and reliability of the AWS X-Ray traces ingestion
- Changed the latencies through the console to consistently display 90th percentiles
- Fixed OpenTelemetry tracing for callback-based AWS Lambda functions
- Fixed defect where auto-instrumentation with no API Key would result in failures