#
AWS Lambda Logs
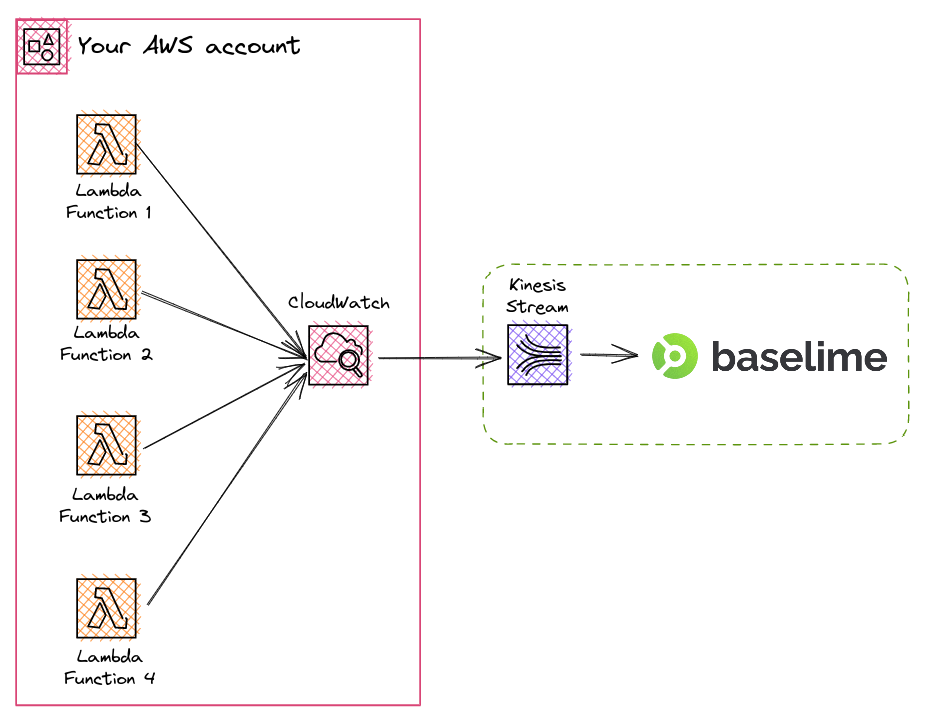
Once you connect your AWS account to Baselime, it automatically creates CloudWatch Logs subscription filters to ingest logs from your AWS Lambda functions.
Baselime automatically captures logs for newly created AWS Lambda functions, and enables you to query and visualise logs across multiple log groups and log streams.
It is possible to send logs from AWS Lambda functions to Baselime directly using the
#
How it works
Once Baselime is connected to an AWS Account, it automatically creates Logs subscription filters for all the AWS Lambda functions in the account. Log subscription filters enable Baselime to asynchronously ingest logs from the AWS Lambda functions through Amazon CloudWatch, without any impact on the performance of the AWS Lambda functions.
Moreover, Baselime automatically creates new subscription filters for newly deployed AWS Lambda functions. Baselime listens to new AWS Lambda events in Amazon CloudTrail and creates subscription filters for newly created AWS Lambda functions.
#
Logs using the AWS Lambda Extension
This section is relevant only if you want to disable logs from Amazon CloudWatch and send logs from your AWS Lambda functions directly to Baselime.
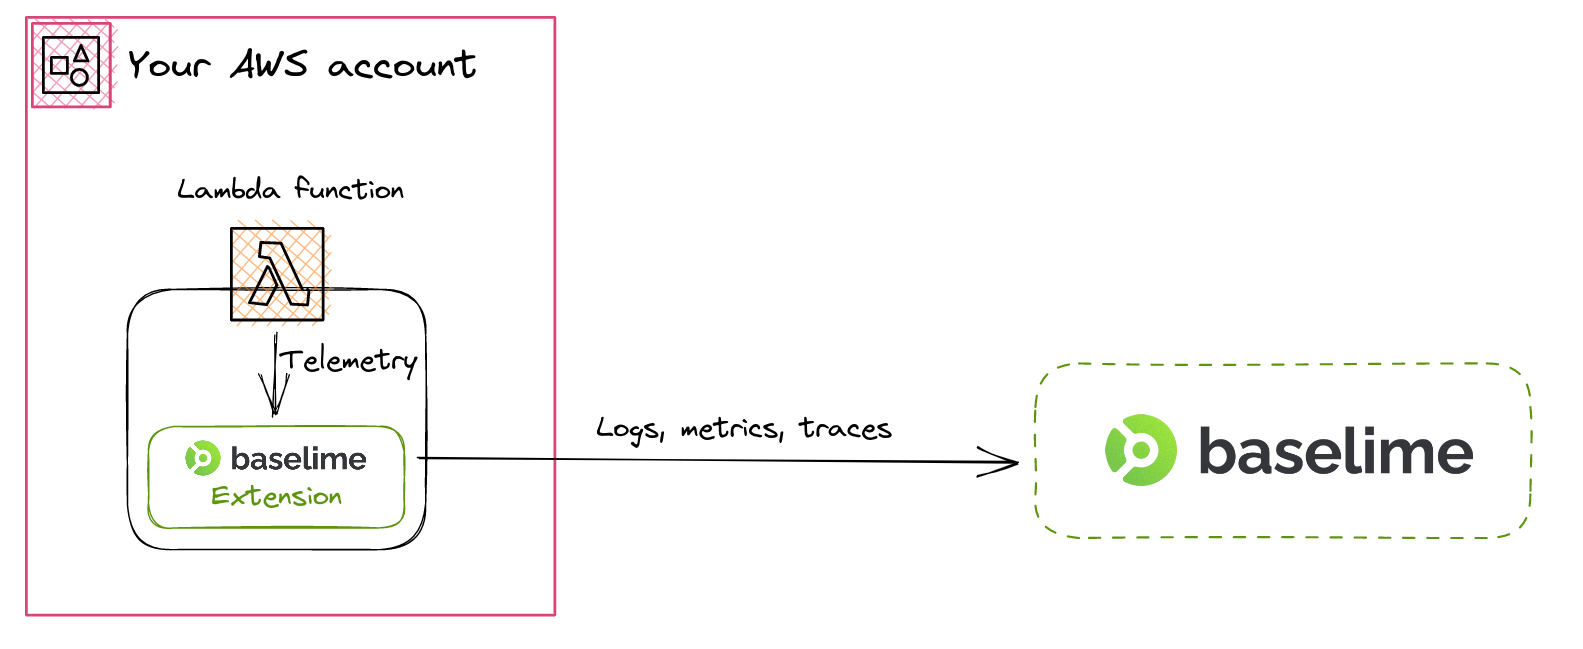
For use-cases where you want to by-pass Amazon CloudWatch and send logs directly to Baselime from your AWS Lambda functions, use the Baselime AWS Lambda Extension.
The Baselime AWS Lambda Extension listens to invocation events and collects telemetry data, such as logs and runtime metrics.
#
Instrumenting
To instrument your AWS Lambda Functions with the Baselime AWS Lambda Extension, add the extension as an AWS Lambda Layer.
It is required to add your public Baselime API key to your functions as an environment variable.
# serverless.yml
service: myService

provider:
  name: aws
  runtime: python3.8
  environment:
    BASELIME_KEY: <BASELIME_KEY>
  layers:
    - <BASELIME_LAMBDA_LAYER_ARN>

functions:
  hello:
    handler: handler.hello
Where the BASELIME_KEY is your public Baselime API Key and the BASELIME_LAMBDA_LAYER_ARN is the ARN of the Baselime AWS Lambda extension in your region.
`arn:aws:lambda:${region}:097948374213:layer:baselime-extension-${'x86_64' || 'arm64'}:25`The Baselime AWS Lambda Extension is language agnostic and is compressed as a single binary, to minimise its impact cold-starts and performance.
All the logs from your AWS Lambda function is collected asynchronously from your invocation, and sent to the Baselime backend in a separate process from your invocation, with no impact on the latency your users experience.
#
Configuration
When using the Baselime AWS Lambda Extension, it is not necessary to use Amazon CloudWatch for AWS Lambda logs. To disable Amazon Cloudwatch logs, add an explicit deny IAM policy that prevents the creation of log streams and log events for your function.
{
  "Version": "2012-10-17",
  "Statement": [
    {
      "Effect": "Deny",
      "Action": [
        "logs:CreateLogStream",
        "logs:PutLogEvents"
      ],
      "Resource": "*"
    }
  ]
}
#
Logging best practices
In order to get the most out of Baselime, we recommend adding two log messages to all your AWS Lambda functions:
- the event which triggered your Lambda function
- the response your Lambda function returns
These can be added as follows:
exports.handler = async (event, context) => {
  console.log(JSON.stringify({ message: "baselime:trigger", level: "baselime", data: { event }));

  // Your logic
  const response = await yourLogic();

  console.log(JSON.stringify({ message: "baselime:response", level: "baselime", data: { response }));
  return response;
});
To facilitate this in Node.js runtimes, we maintain a custom logger well suited for AWS Lambda.
npm i @baselime/lambda-loggerIt's a 2.5kb JavaScript file with 0 dependencies, and does not have any significant impact on performance or cold-starts.
const { wrap } = require('@baselime/lambda-logger');

exports.handler = wrap(async (event, context) => {
   // Your logic
});
It also provides an interface to be used as a middy middleware.
import { logger, Baselime } from "@baselime/lambda-logger";
import middy from "@middy/core";

exports.handler = middy()
	.use(Baselime())
	.handler(function (e, context) {
		// Your logic
	});
#
Logging format
We recommend using structured logging across your application, preferably in JSON format. Feel free to use your favourite logging library; we recommend:
import { logger } from "@baselime/lambda-logger";

console.log(JSON.stringify({
  message: "This log is awesome",
  level: "info",
  data: { customer_id: "cus_1234", accountType: "premium" }
}));

logger.info("This log is awesome", { customer_id: "cus_1234", accountType: "premium" });
It is particularly important to format errors and exception correctly to appropriately log stack traces.
const error = new Error("A message for the error");

console.error(JSON.stringify({
  message: "Unfortunately something went wrong",
  level: "error",
  data: {
    customer_id: "cus_1234",
    accountType: "premium",
    error: {
      message: error.message,
      name: error.name,
      stack: error.stack
    }
  }
}));
or with the Baselime Lambda Logger for Node.js:
import { logger } from "@baselime/lambda-logger";

logger.info("Unfortunately something went wrong", { customer_id: "cus_1234", accountType: "premium" }, error);
#
Discovered Keys
Baselime automatically discovers key - value pairs from your AWS Lambda logs. This enables you to run complex queries and setup alerts on data that otherwise would be difficult to work with from the AWS Lambda service. For instance, from the discovered keys from the Lambda logs, it's possible to set alerts on the maximum memory used by lambda functions during execution, compared to the amount of memory they are assigned at deployment time.
#
Lambda Discovered Keys
The Lambda service automatically writes logs at the start and end of every function invocation. These logs are parsed as events in Baselime, and keys are automatically discovered from those messages.
#
START Log Message
The following keys are discovered from the START message:
@type: is alwaysSTART@requestId: the request ID of the Lambda invocation@version: the invoked version of the Lambda function
 START RequestId: d5d410e5-7406-5a1b-888e-4aa7492a313d Version: $LATEST

{
  @type: "START",
  @requestId: "d5d410e5-7406-5a1b-888e-4aa7492a313d",
  @version: "$LATEST"
}
#
END Log Message
The following keys are discovered from the END message:
@type: is alwaysEND@requestId: the request ID of the Lambda invocation
 END RequestId: d5d410e5-7406-5a1b-888e-4aa7492a313d

{
  @type: "END",
  @requestId: "d5d410e5-7406-5a1b-888e-4aa7492a313d",
}
#
REPORT Log Message
The following keys are discovered from the REPORT message:
@type: is alwaysREPORT@requestId: the request ID of the Lambda invocation@duration: the duration in milliseconds@billedDuration: the billed duration in milliseconds@memorySize: the total memory available to the invocation, in MB@maxMemoryUsed: the max memory used, in MB@initDuration: the duration of the lambda initialisation in milliseconds (cold starts)
If the Lambda function is instrumented with XRAY, additional keys are discovered:
@xRAYTraceId: the XRAY trace ID@segmentId: the XRAY segment ID@sampled: alwaystrue
REPORT RequestId: 8fc6f963-411b-58b5-8483-a32130c0f45d Duration: 201.67 ms Billed Duration: 202 ms Memory Size: 2048 MB Max Memory Used: 81 MB Init Duration: 480.25 ms XRAY TraceId: 1-61c86fa4-59b3c6d959653c527fd10966 SegmentId: 107ea78a5750a811 Sampled: true

{
  @type: "REPORT",
  @requestId: "8fc6f963-411b-58b5-8483-a32130c0f45d",
  @duration: 201.67,
  @billedDuration: 202,
  @memorySize: 2048,
  @maxMemoryUsed: 81,
  @initDuration: 480.25,
  @xRAYTraceId: "1-61c86fa4-59b3c6d959653c527fd10966",
  @segmentId: "107ea78a5750a811",
  @sampled: true
}
#
Timeout Invocations
If your async Lambda invocation times out, Additional keys are automatically discovered:
@timedOut: alwaystrue@timeout: the duration after which the invocation timed-out in seconds@message: alwaysTask timed out after {@timeout} seconds@timestamp: the timestamp at the moment the invocation timed out.
 2021-12-26T13:15:48.760Z 5b252591-51c6-5d15-87a9-7fd33ce32be4 Task timed out after 15.01 seconds

{
  @timestamp: "2021-12-26T13:15:48.760Z",
  @requestId: "5b252591-51c6-5d15-87a9-7fd33ce32be4",
  @timedOut: true,
  @message: "Task timed out after 15.01 seconds",
  @timeout: 15.01
}
#
console.log Log Message
For Node.js environments, AWS Lambda uses a modified version of console.log (and other console logging functions) to write to stdout and stderr. These add fields to the log message which are parsed as follows:
@timestamp: the timestamp at the moment the log message was written@requestId: the request ID of the Lambda invocationLogLevel: the log level (INFO,DEBUG,WARN,ERROR)message: the log string
If the message in @message is a valid JSON object, Baselime will parse it, otherwise it will be considered a string.
 2021-12-26T14:00:19.258Z e578aebe-054e-4844-835c-66a75d3112cf ERROR Error doing something.

{
  @timestamp: "2021-12-26T14:00:19.258Z",
  @requestId: "e578aebe-054e-4844-835c-66a75d3112cf",
  LogLevel: "ERROR",
  @message: "Error doing something."
}
#
Troubleshooting
If you're having trouble sending data from your AWS Lambda logs to Baselime, here are a few things to check:
- Verify that your AWS account is correctly connected to Baselime and you receive data in other datasets such as CloudTrail Events
- Check that your Lambda functions are not already using the maximum number of subscription filters allowed per log group. AWS limits each log group to 2 subscription filters at most. If you're already at the limit, you can remove subscription filters with the cloudwatch-subscription-filters-remover to delete the ones you don't need anymore.
- Make sure that your AWS Lambda functions are being invoked and you can view the logs in the CloudWatch section of the AWS Console