#
OpenTelemetry for Next.js
Instrument your Next.js applications with OpenTelemetry using the the Baselime Node.js OpenTelemetry SDK.
If you deploy your Next.js applications on Vercel, install the Vercel Baselime Integration to enable logs in addition to distributed tracing.
#
Instrumentation
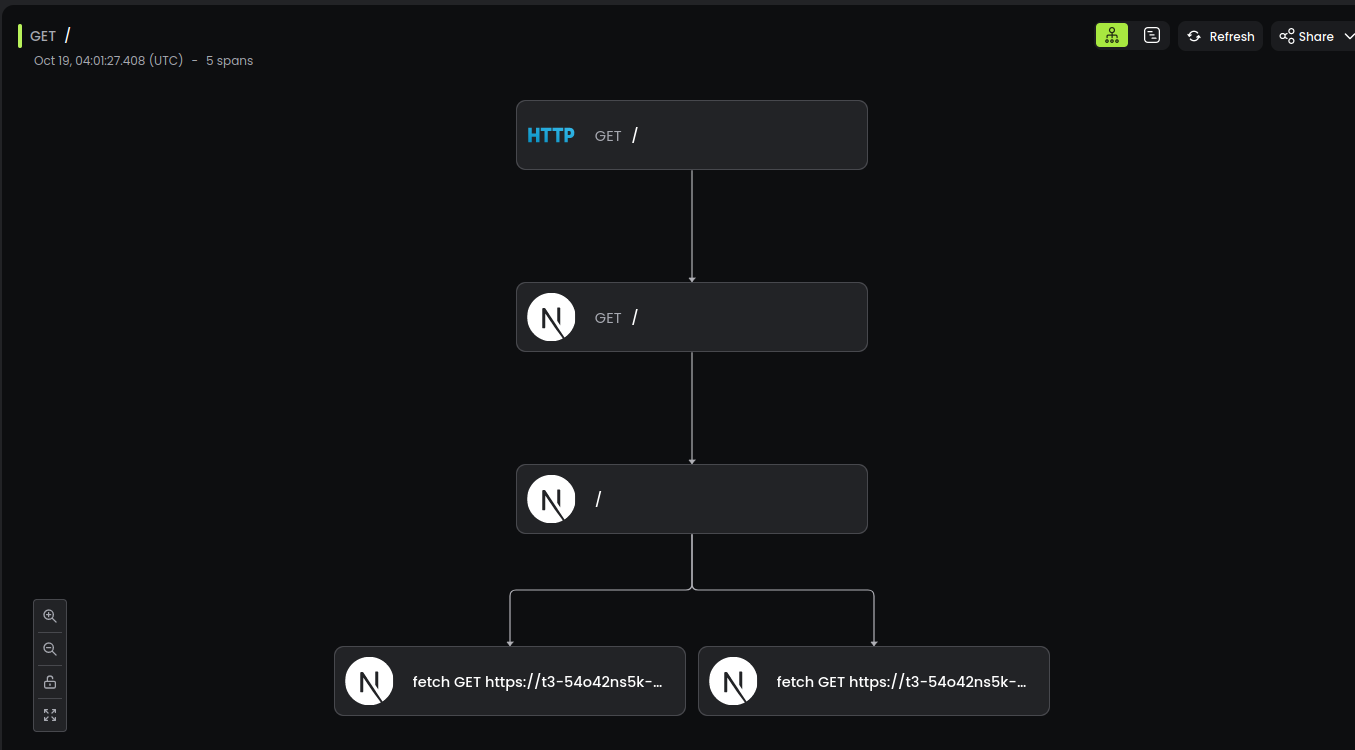
Check out a complete example including Prisma and tRPC in our GitHub Examples Repo.
#
Step 1: Install the SDK
Install @baselime/node-opentelemetry in your project.
npm i @baselime/node-opentelemetry
#
Step 2: Initialise the tracer
Create a file instrumentation.ts in the root of your project and add the following code to configure and initialize OpenTelemetry.
export async function register() {
  if (process.env.NEXT_RUNTIME === 'nodejs') {
    const { BaselimeSDK, VercelPlugin, BetterHttpInstrumentation } = await import('@baselime/node-opentelemetry');

    const sdk = new BaselimeSDK({
      serverless: true,
      service: "your-project-name",
      instrumentations: [
        new BetterHttpInstrumentation({
          plugins: [
            // Add the Vercel plugin to enable correlation between your logs and traces for projects deployed on Vercel
            new VercelPlugin()
          ]
        }),
      ]
    });

    sdk.start();
  }
}
If you use a /src folder your project, add the instrumentation.ts file in the /src folder instead of the root folder.
#
Step 3: Set the Baselime environment variables
Set the BASELIME_KEY environment variable to your Baselime public API Key. Get your pulic API key from the Baselime console.
#
Step 4. Enable Next.js Auto Instrumentation
Next.js 13.4+ supports auto-instrumentation. Add experimental.instrumentationHook = true to your next.config.js to enable auto-instrumentation of all the requests your app makes to external services.
await import("./src/env.mjs");

/** @type {import("next").NextConfig} */
const config = {
    experimental: {
        instrumentationHook: true,
    }
};

export default config;
Once these steps are completed, distributed traces from your Next.js application should be available in Baselime to query via the console or the Baselime CLI.
#
Tracing your tRPC applications
tRPC is a framework that enables you to easily build & consume fully typesafe APIs without schemas or code generation. The Baselime Node OpenTelemetry SDK enables automatically tracing your tRPC applications with its tRPC middleware.
#
Adding custom OpenTelemetry spans
To add custom spans to your OpenTelemetry traces, install the @opentelemetry/api package.
npm i @opentelemetry/apiAnd manually add spans to your traces.
import { trace } from "@opentelemetry/api";
import { useSearchParams } from 'next/navigation'

const tracer = trace.getTracer('your-custom-traces');

export default async function Home({}) {
    const searchParams = useSearchParams()

  const search = searchParams.get('search')
  const span = trace.getActiveSpan();

  span.setAttribute('search', search)

  const result = await tracer.startActiveSpan(`business-logic`, async (span) => {
    // your business logic
    const input = { search }
    span.setAttributes(input);
    const result = await yourBusinessLogic(input)
    span.setAttributes(result)
    span.end();
    return result
  });

  return (
    <main className="flex min-h-screen ...">
      <div className="container flex flex-col items-center justify-center gap-12 px-4 py-16 ">
        ...
        </div>
    </main>
  )
}